Ongoing Liquidity Trends for Michigan Banks
DISCLAIMER: This is a personal blog. Any views or opinions expressed in this blog do not represent the official policy or position of the Michigan Department of Insurance and Financial Services.
Introduction
The goal of this article will be to identify ongoing liquidity trends for Michigan Banks. In my last article titled Liquidity Determinants of Michigan Banks, I investigated bank-specific factors that affect the level of liquid assets held by state-chartered Michigan Banks. This analysis used balanced panel data for 59 state-chartered commercial banks from December 31st, 2019, until June 30th, 2023. Fixed effect regression analysis concluded that profitability, deposits, capital adequacy, interest margin, and asset quality have a significant effect on the level of liquid assets. Using the same dataset, this article will further analyze these bank-specific factors. Small, medium, and large Michigan banks with assets totaling less than $300 million, $300 million to $1 billion, and over $1 billion, respectively, will be analyzed independently.
Liquidity Trends Over the Past Year
As of June 30th, 2023, the average level of liquid assets held by Michigan banks has declined over the past four quarters. Average liquid assets have declined by 9.23, 33.02, and 37.92 percent for small, medium, and large Michigan banks, respectively. The decline in average liquid assets for Michigan banks has been driven by declining interest-bearing bank balances. Declining interest-bearing bank balances as well as an increase in wholesale funds have been utilized to grow average total loans.
Average total loans for Michigan banks have grown over the past year. The level of average total loans has grown by $10.5, $64.4, and $115.9 million for small, medium, and large banks, respectively. Loan growth for Michigan banks has been driven by the growth of residential and commercial real estate. Average residential real estate loans for Michigan banks have grown by 21 percent while commercial real estate loans have grown by 13 percent year over year. As a result of loan growth and the rising interest rate environment, average loan & lease income has grown by 32, 43, and 42 percent for small, medium, and large Michigan Banks.
In my prior article, net interest margin was found to have a significant negative effect on the level of liquidity for Michigan banks. This is likely due to an increase in opportunity cost for banks. When the yield on illiquid assets increases, the opportunity cost of holding lower yielding liquid assets grows. Average net interest margin has increased by 46, 47, and 45 basis points for small, medium, and large Michigan banks, respectively. The growth of average net interest margin for Michigan banks has been largely due to the growth of loans and loan income.
Another key finding from my prior work was that deposits have a significant positive effect on the level of liquid assets held by Michigan banks. It is likely that Michigan banks hold more liquid assets as total deposits increase in order to mitigate risk stemming from an increase in cash demanded from depositors. Average total deposits over total assets have declined by 158, 222, and 270 basis points for small, medium, and large banks, respectively. Based on the findings from my prior study, the declining level of deposits relative to total assets has likely contributed to the decline of average liquid assets. The decline in average total deposits over total assets has been significantly impacted by an increase in the usage of wholesale funding.
As the level of deposits relative to total assets has declined, the average level of wholesale funds held by Michigan banks has increased. The average level of wholesale funds for small, medium, and large Michigan banks has increased by $2.7, $34.6, and $223 million, respectively. The growth of average wholesale funds for small banks has been driven by the average level of FHLB borrowings maturing under 1 year growing $962,500. Increasing average wholesale funds for medium and large banks has been driven by average brokered deposits which have increased by $19,265,320 and $127,540,900, respectively.
The Tier 1 Leverage ratio has a negative effect on the level of liquid assets according to my study on the determinants of liquid assets. Michigan banks with higher Tier 1 Leverage ratios may hold fewer liquid assets due to the increased capacity for capital to absorb losses mitigating some liquidity risk. An additional explanation could be that Michigan banks with a greater level of higher yielding illiquid assets generate more earnings which augment capital. The average Tier 1 Leverage ratio for small, medium, and large Michigan banks have risen 52, 48, and 56 basis points, respectively. Increasing average capitalization for Michigan banks has likely contributed to the decline in average liquid assets according to the results of my prior study.
An additional finding from my article on liquidity determinants was that liquidity is positively affected by the level of nonaccrual loans. Michigan banks with higher levels of nonaccrual loans may hold higher levels of liquidity in order to mitigate the risk of potential loan losses. Over the prior four quarters, the average level of nonaccrual loans over total loans has grown by 4 and 3 basis points for small and large Michigan banks, respectively. Average nonaccrual loans over total loans for Medium sized Michigan banks have declined by 19 basis points over the past year. These changes in the level of nonaccrual loans are marginal and have likely had a small impact on the level of liquidity.
Lastly, my prior article found that return on assets has a positive effect on liquidity for Michigan banks. Michigan banks with high return on assets could have more risk on their balance sheet requiring a larger liquidity buffer to mitigate risk. Average return on assets for small and large Michigan banks have increased 31 and 15 basis points, respectively. Average return on assets for medium sized Michigan banks have remained stable at 1.06 percent. Although my last article found that return on assets has a positive effect on liquidity, average levels of liquidity have fallen as average return on assets for Michigan banks have increased. This is likely due to the rising average net interest margin having a more significant impact on liquidity. In the second fixed effect regression model in my last study, liquidity declined by 8.45 percent for every 1 percent increase in net interest margin while liquidity only increased by 2.73 percent for every 1 percent increase in return on assets.
Banks With Less Than $300 Million in Total Assets
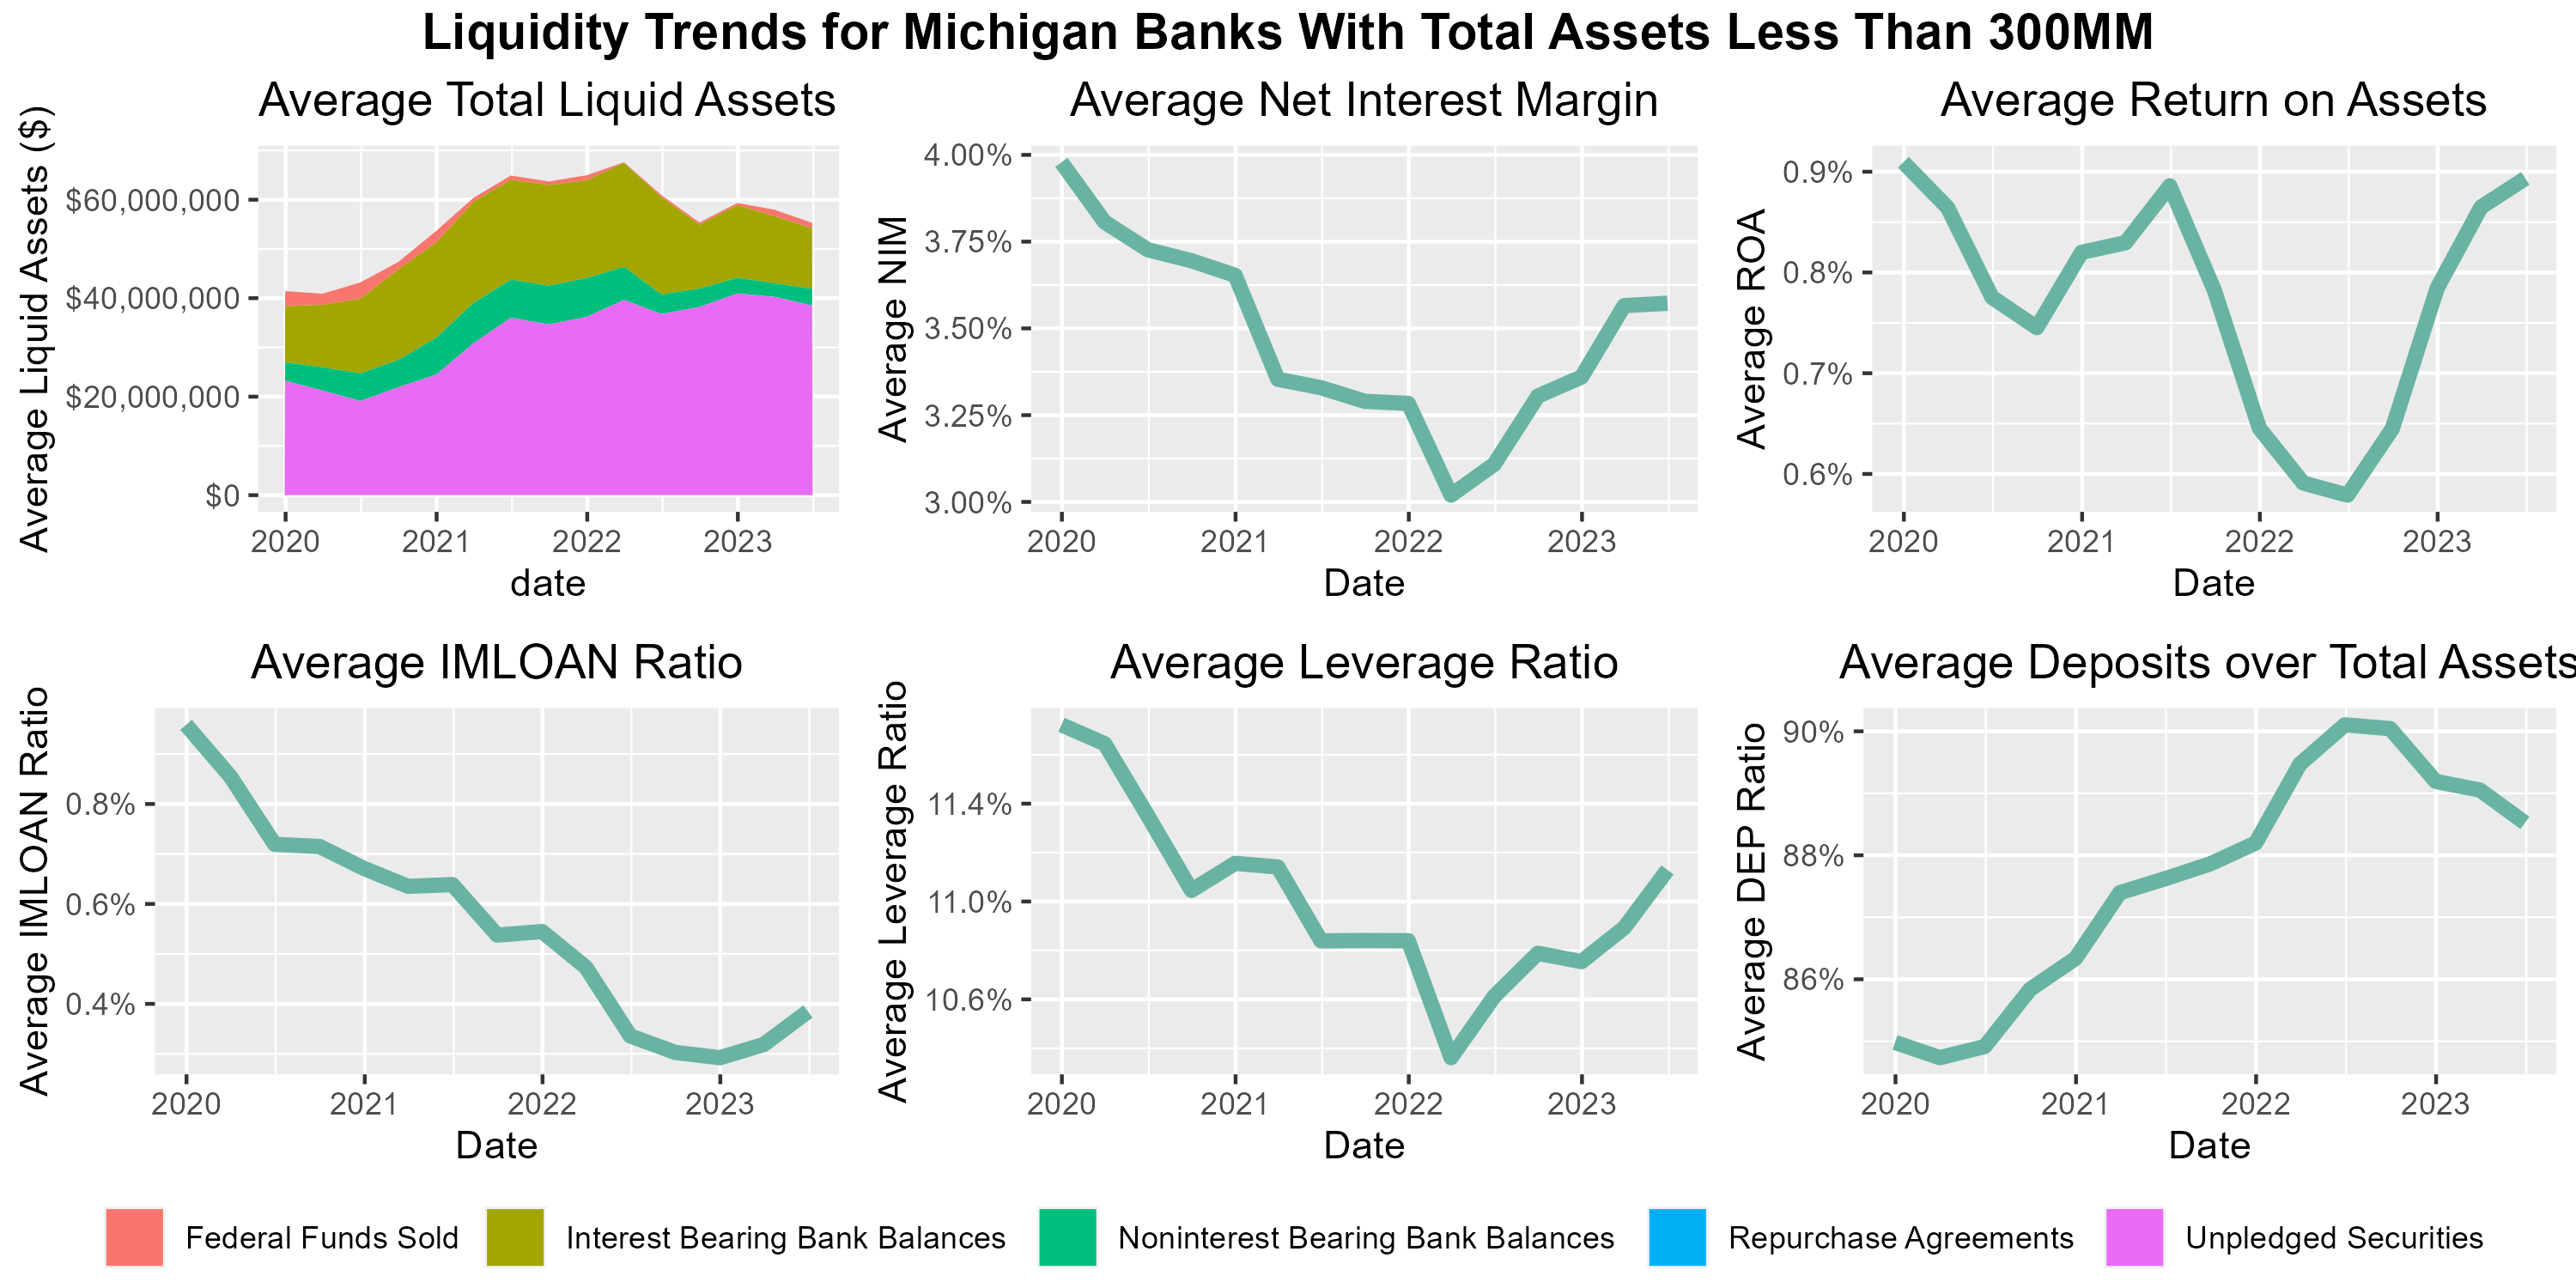
Figure 1. Liquidity Trends for Michigan Banks with Less than $300 Million in Total Assets
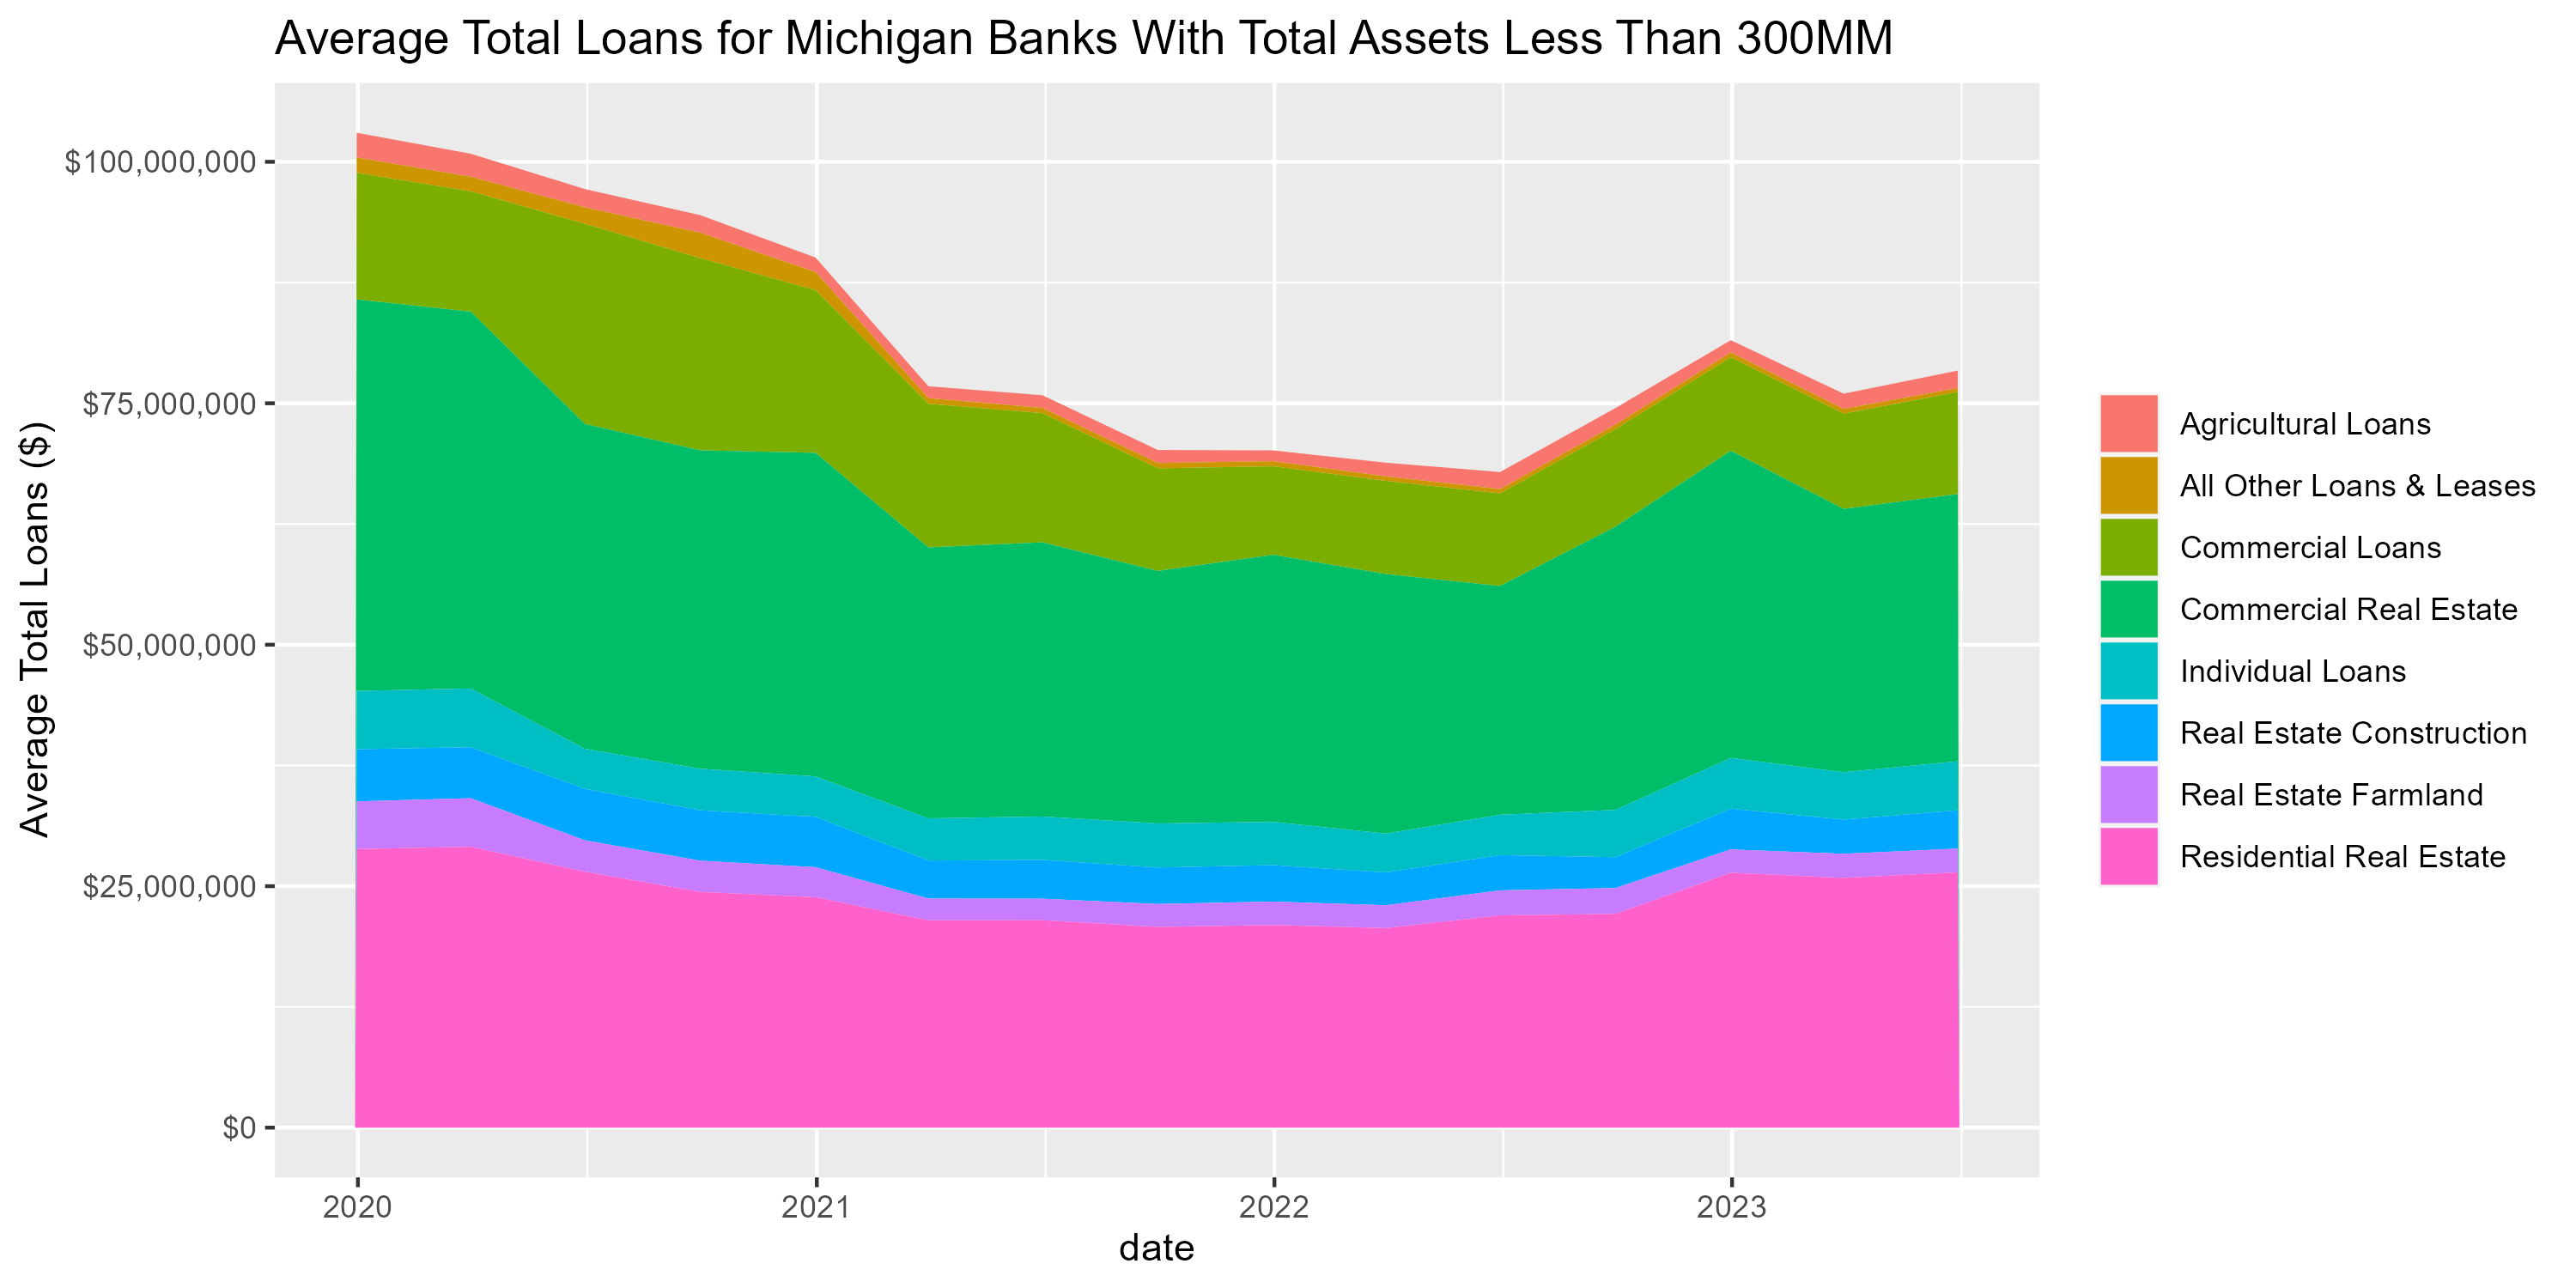
Figure 2. Average Loans for Michigan Banks with Total Assets Less Than $300 million
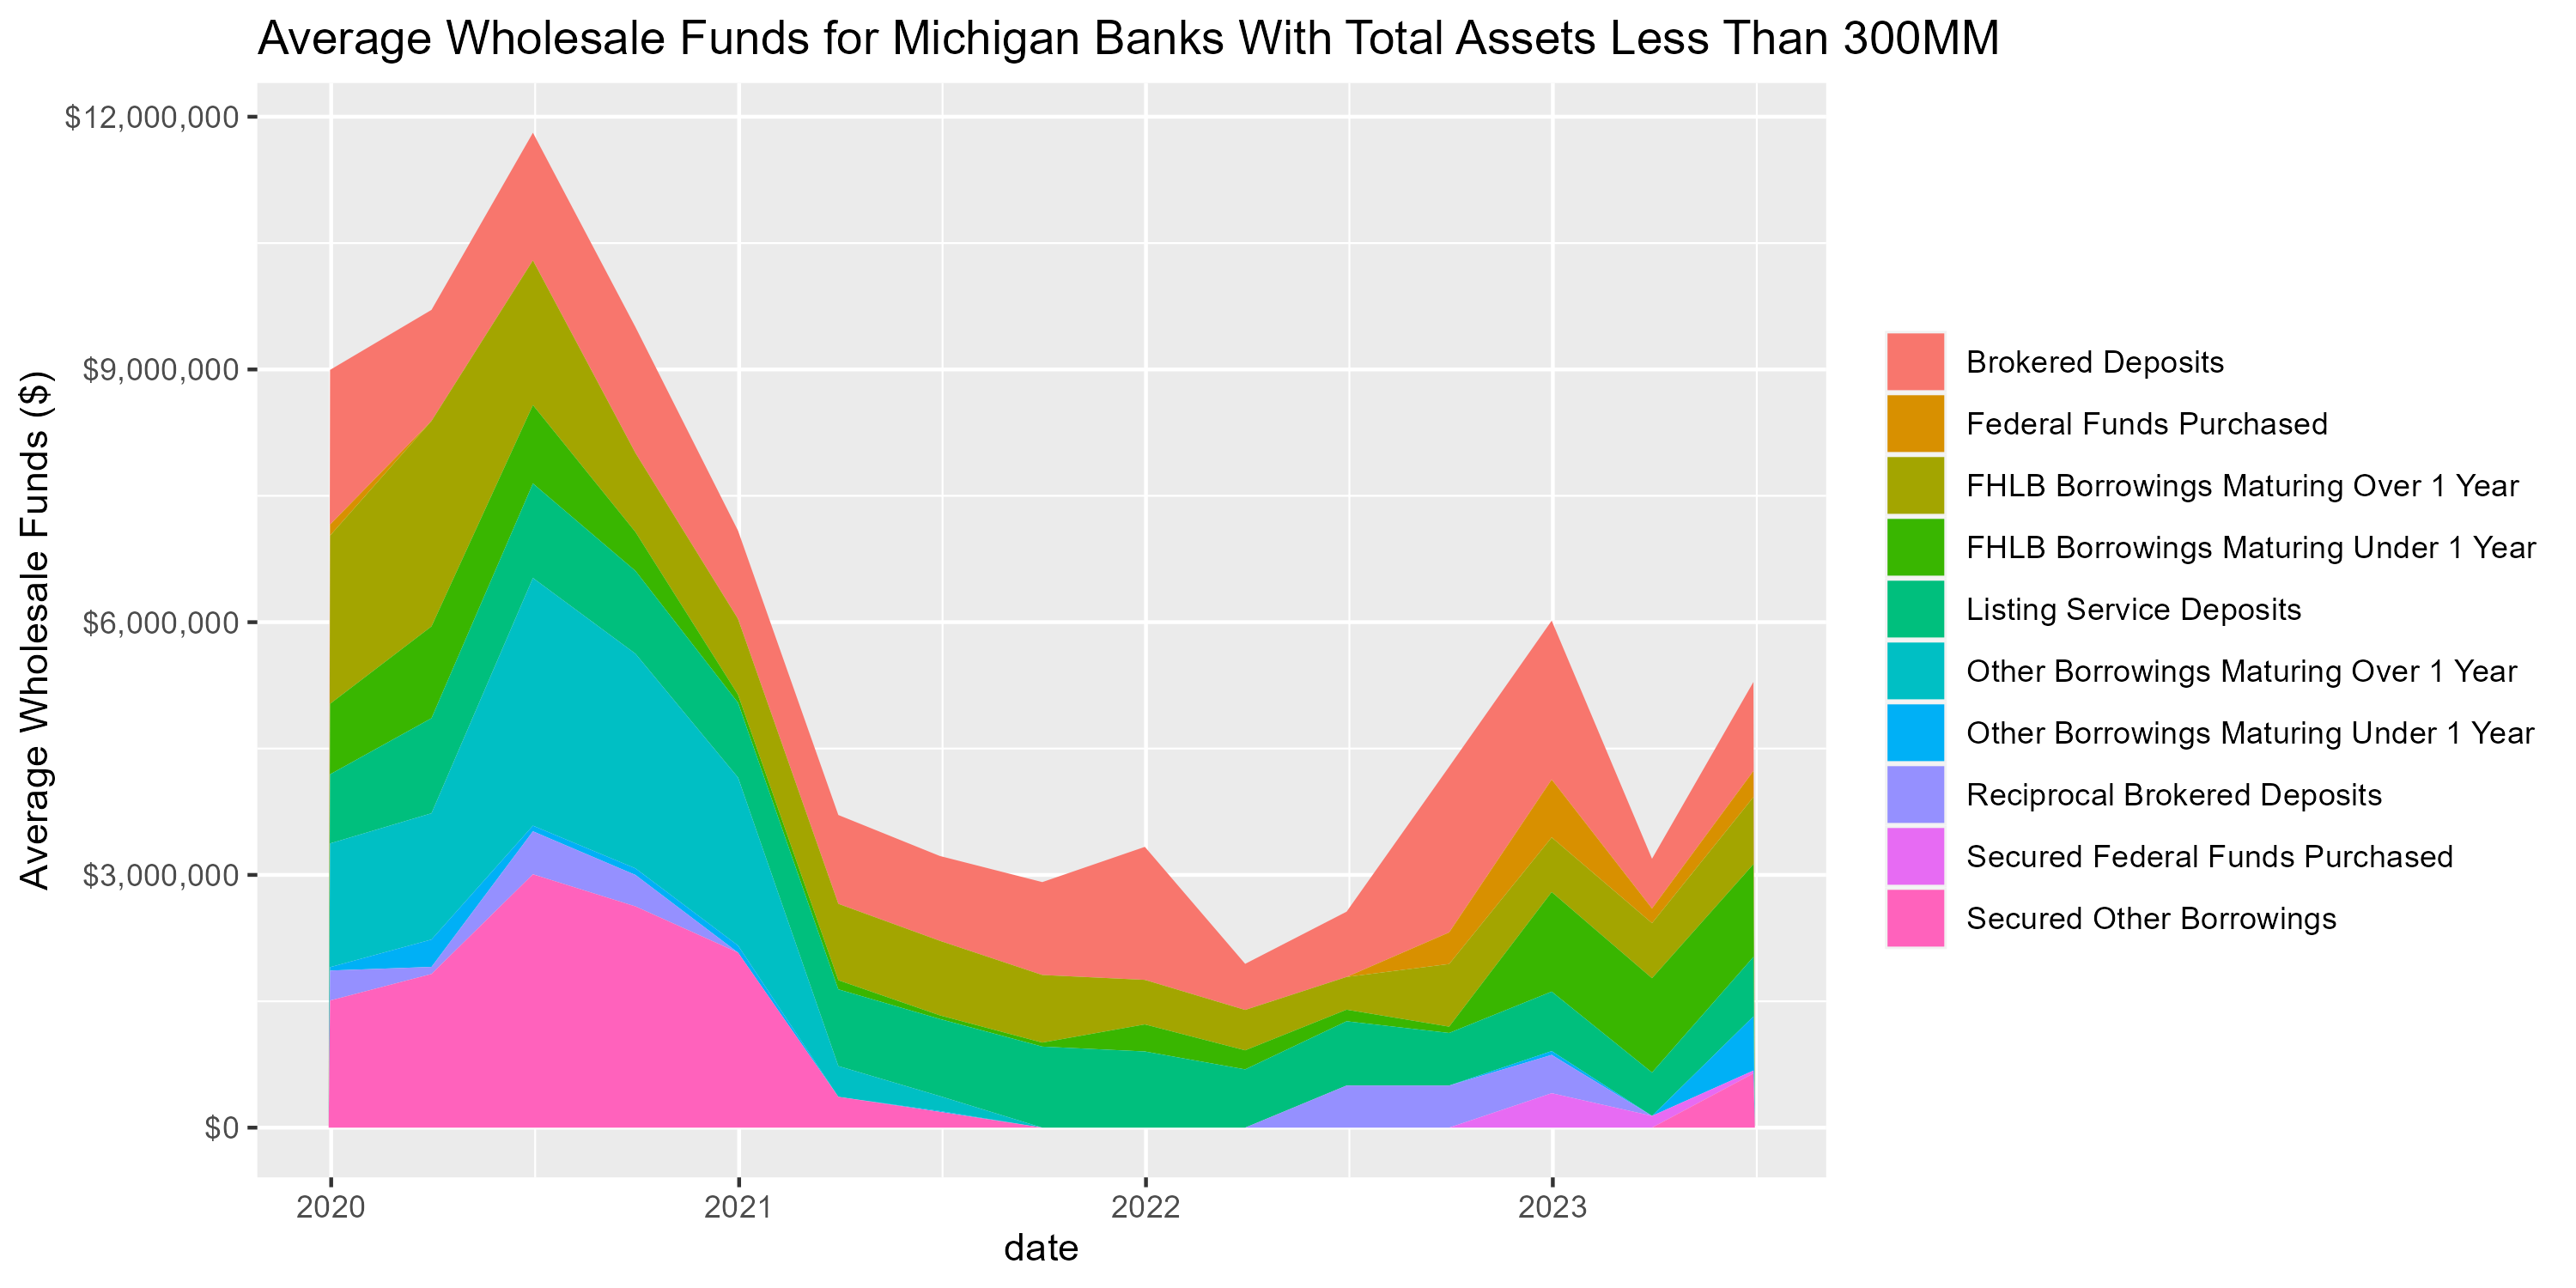
Figure 3. Average Wholesale Funding for Michigan Banks with Total Assets Less Than $300 Million
Banks with Total Assets Between $300 Million and $1 Billion
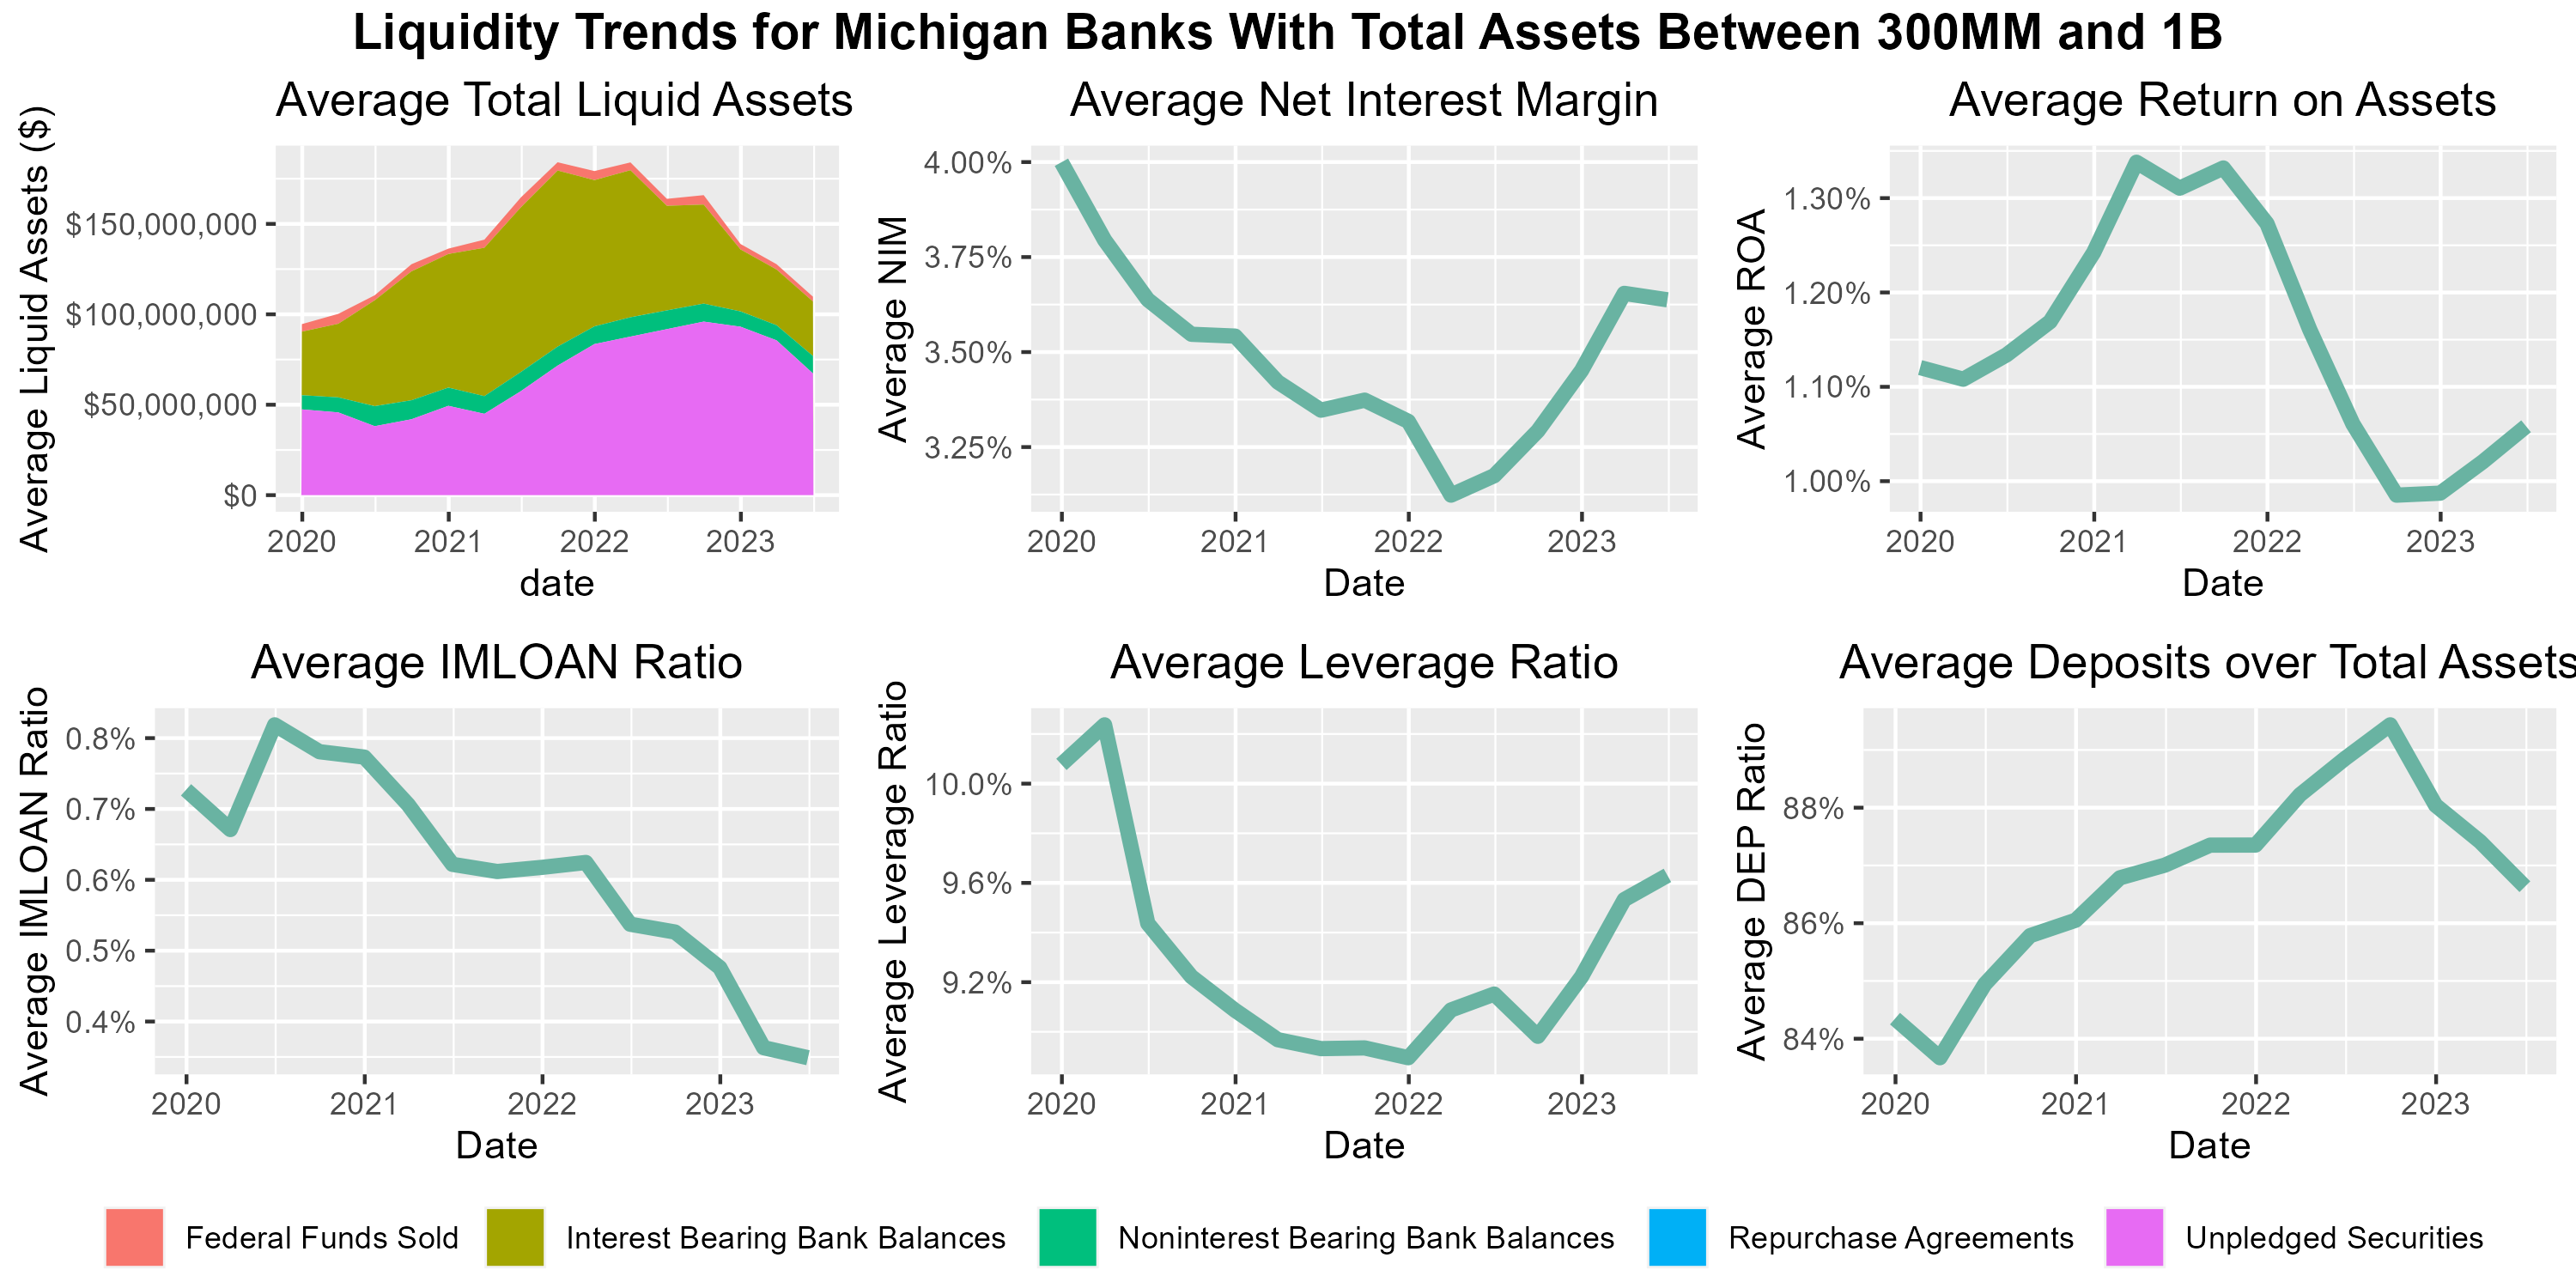
Figure 4. Liquidity Trends for Banks with Total Assets Between $300 Million and $1 Billion
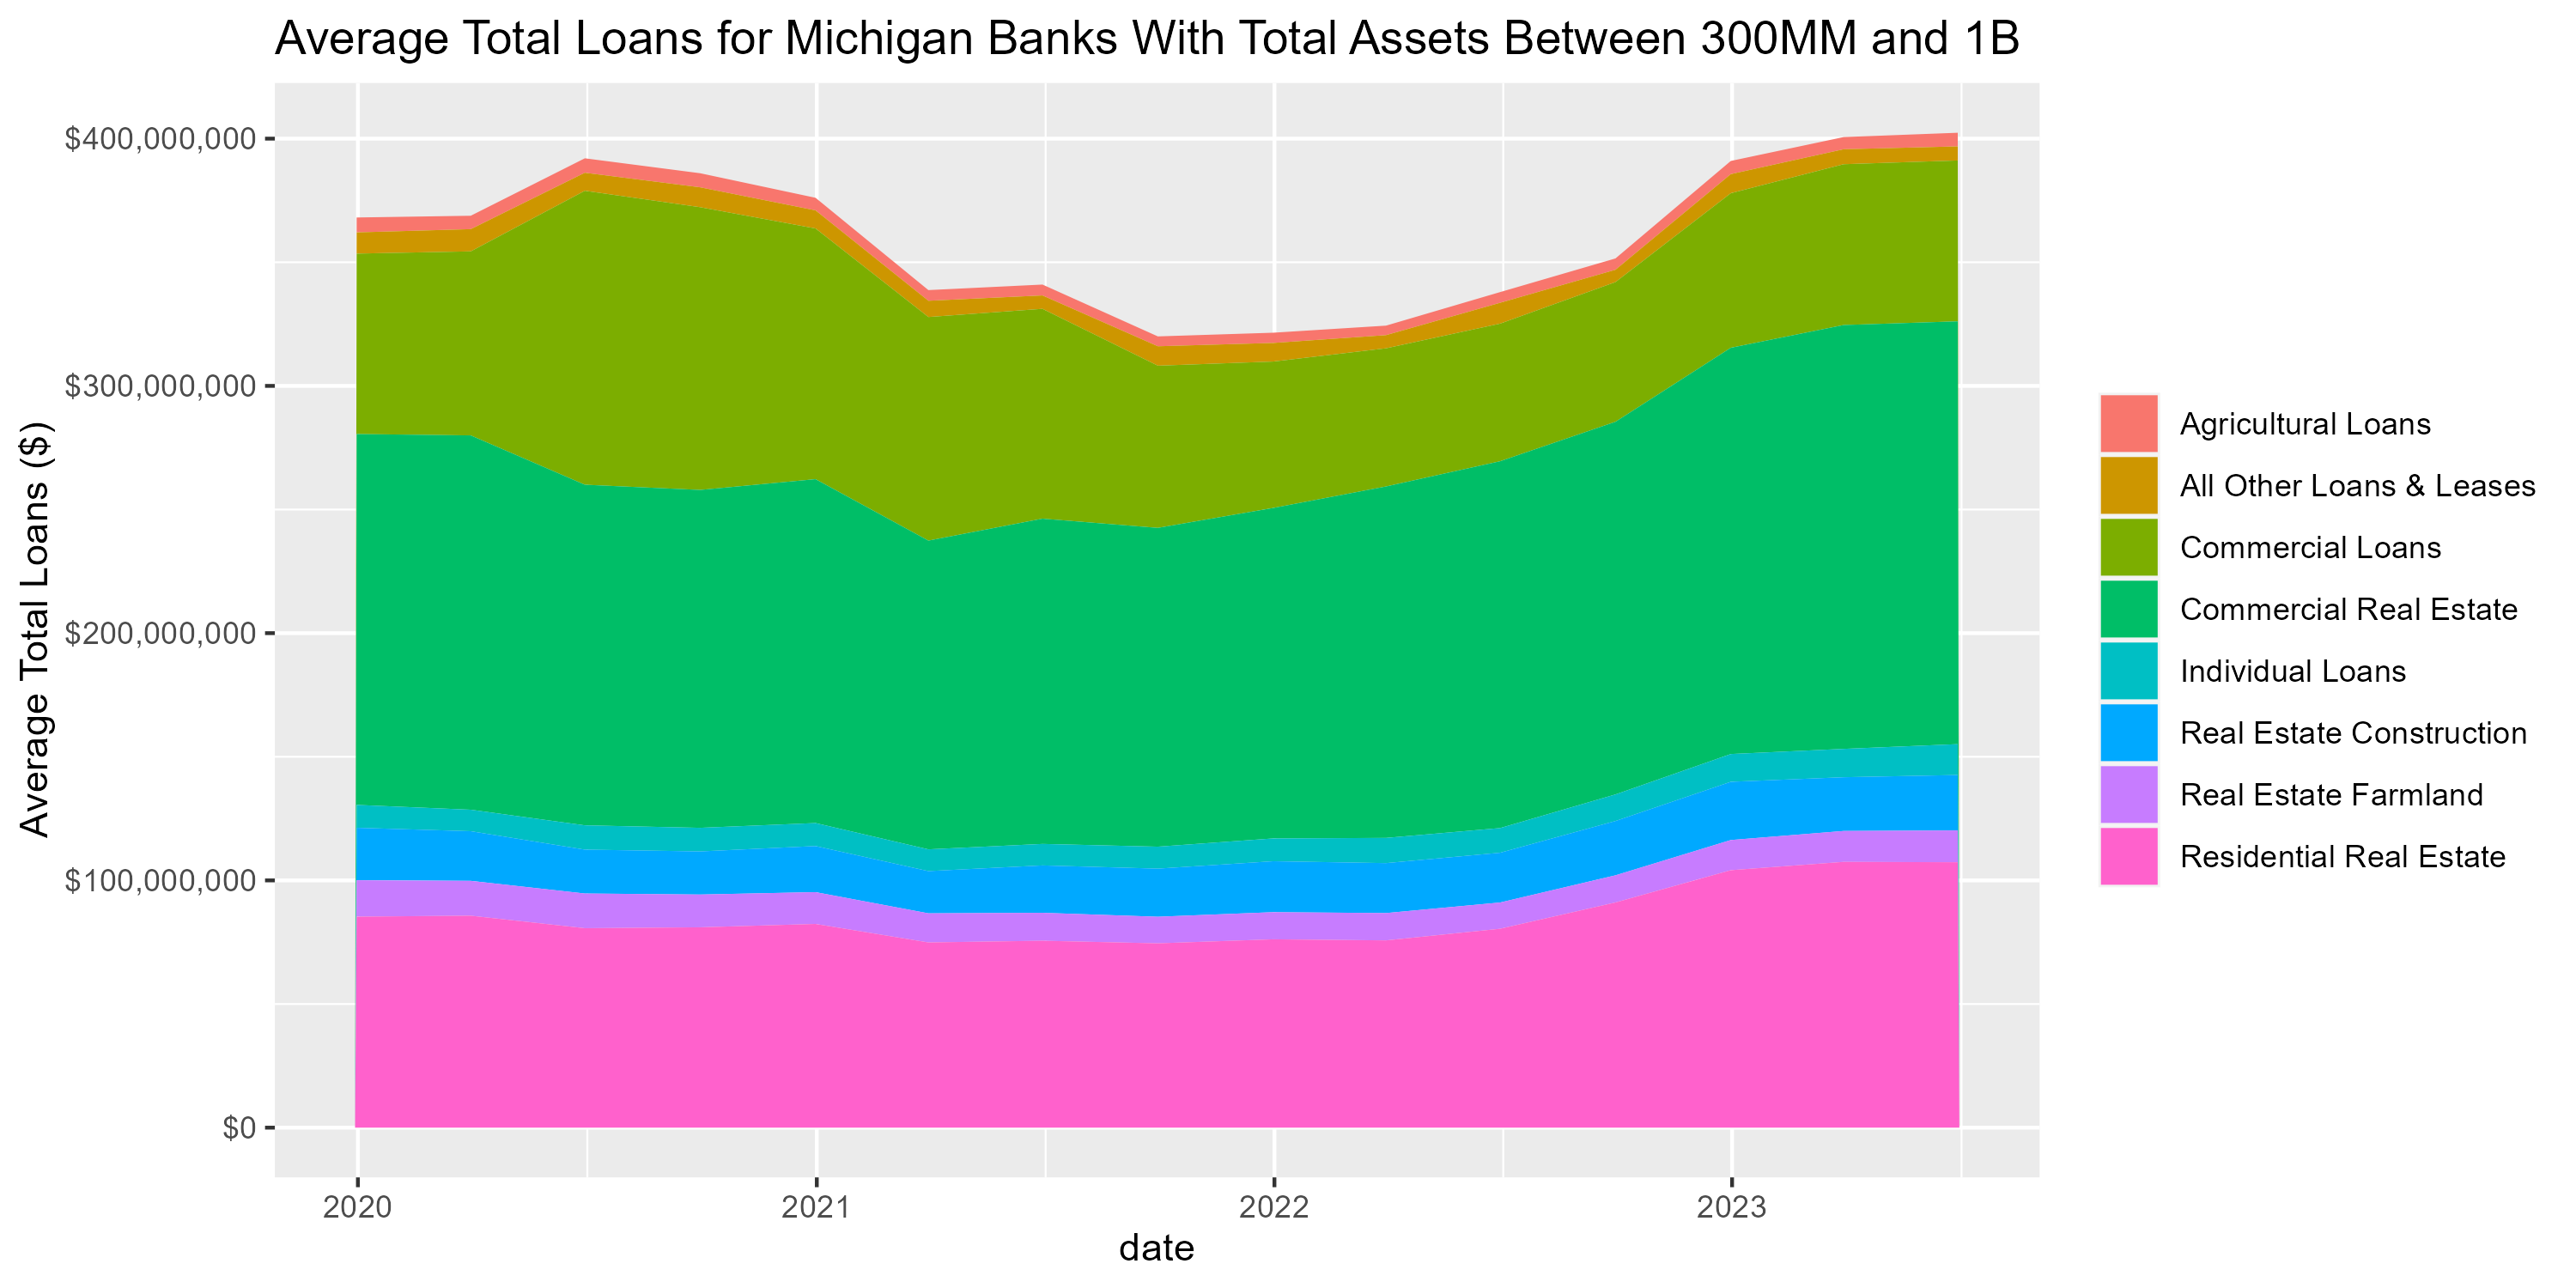
Figure 5. Average Loans for Michigan Banks with Total Assets Between $300 million and $1 Billion
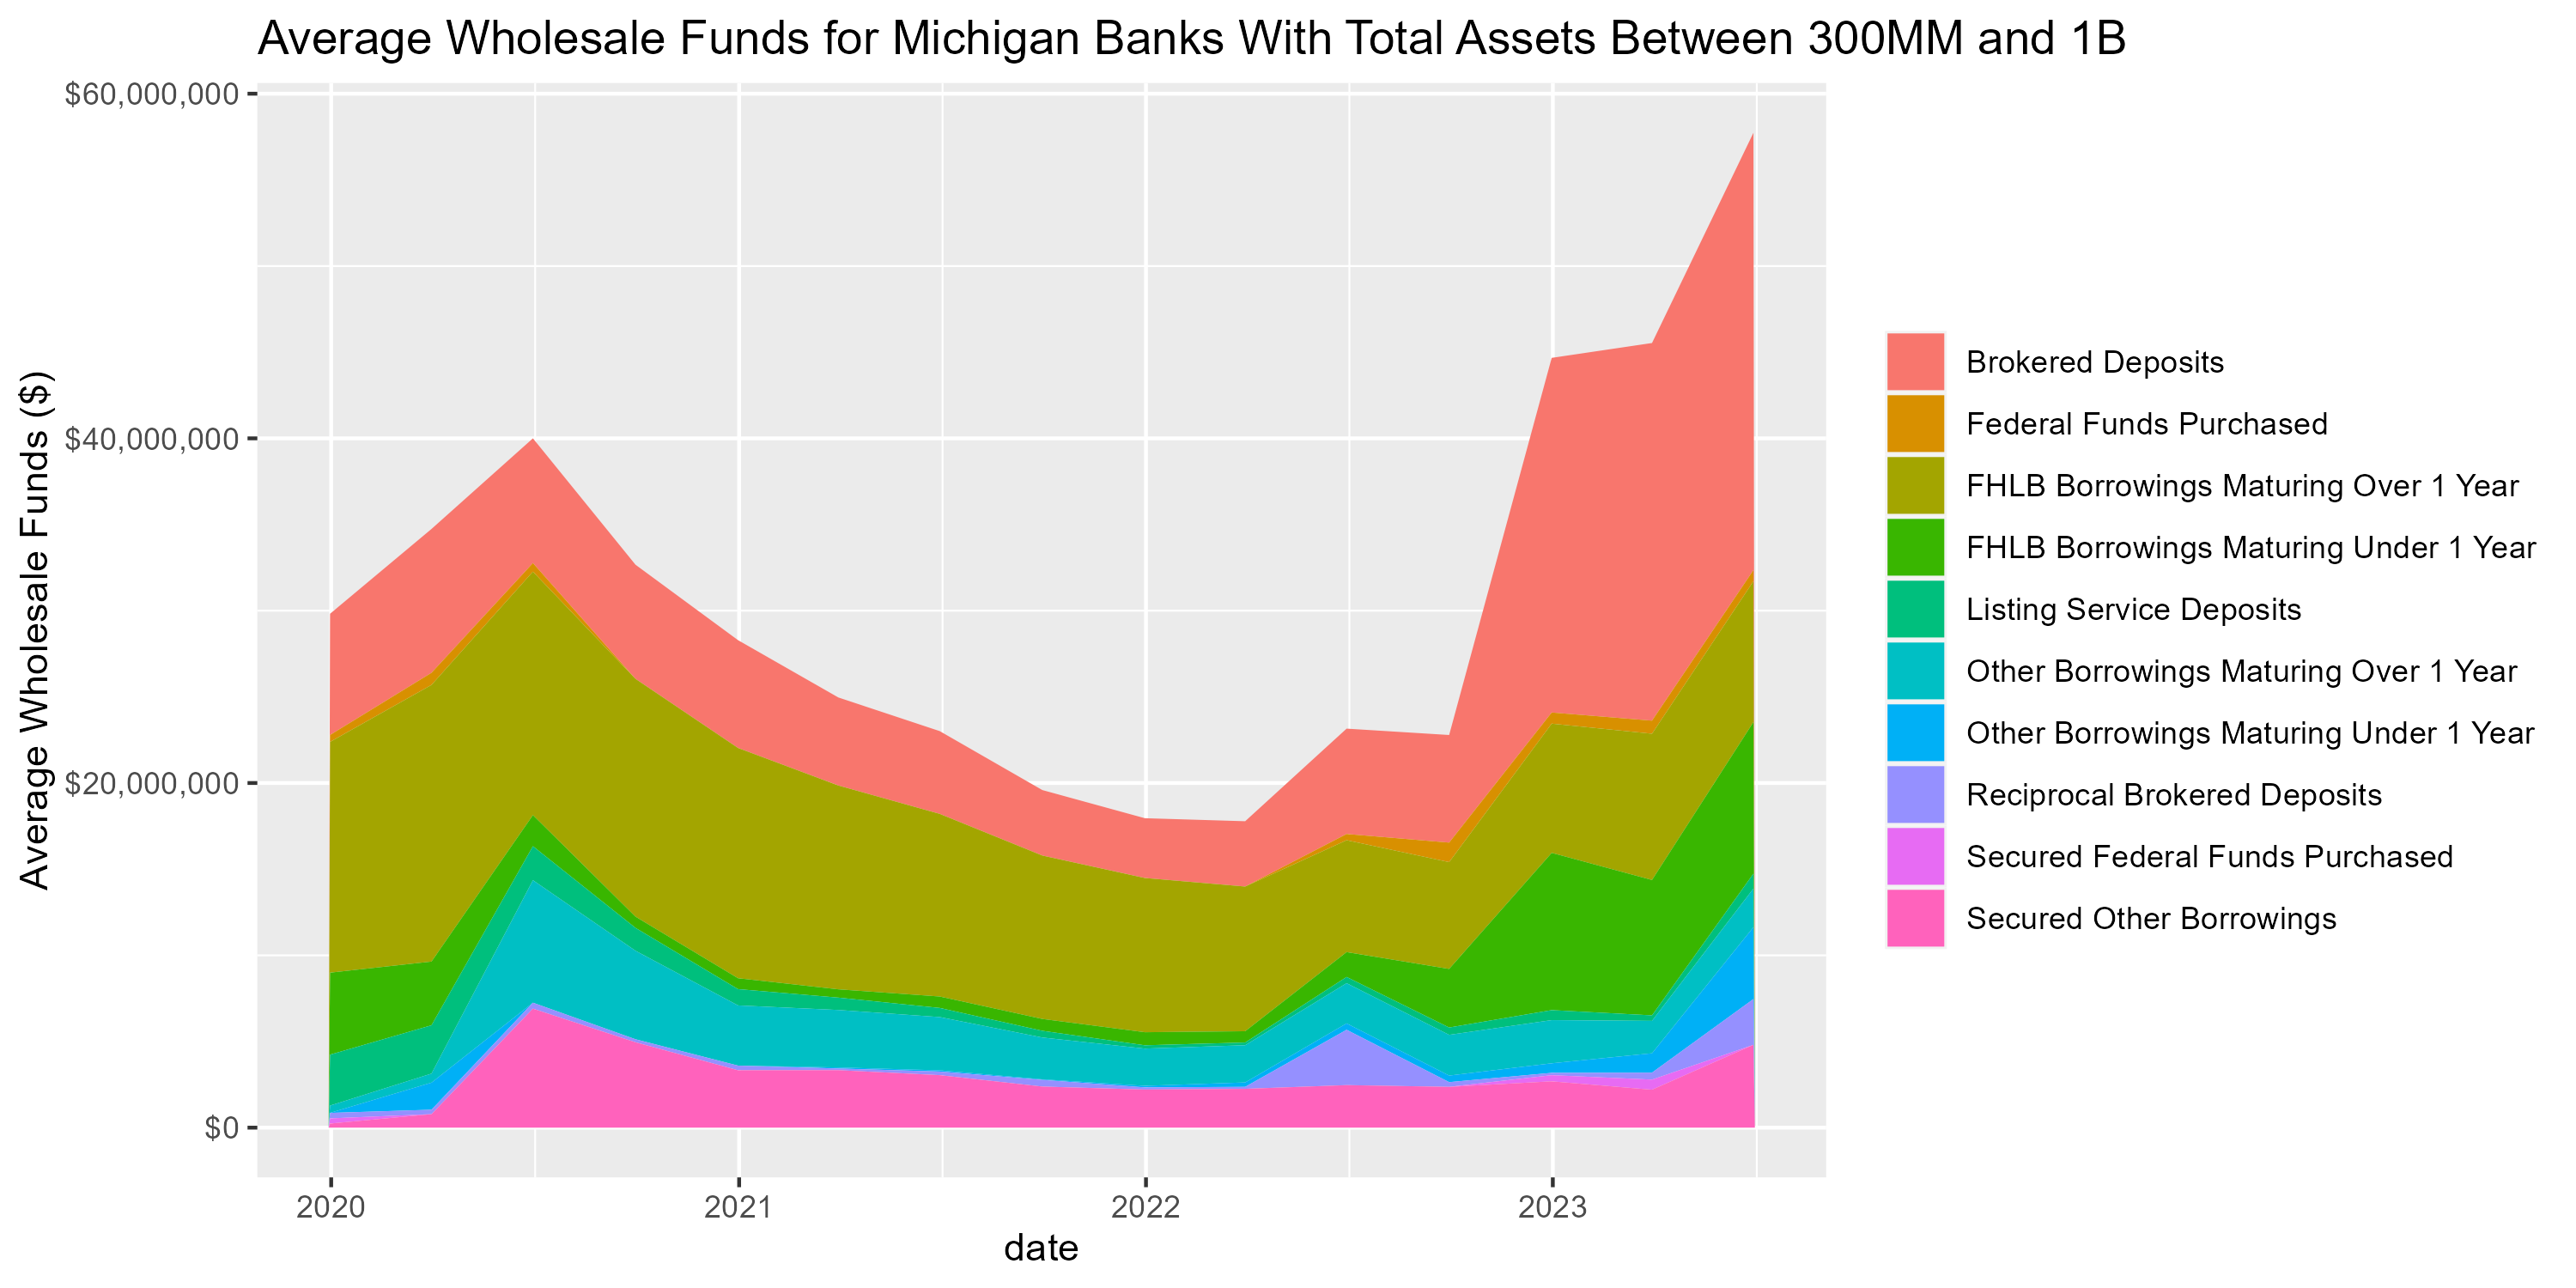
Figure 6. Average Wholesale Funding for Michigan Banks with Total Assets Between $300 Million and $1 Billion
Banks with Total Assets Over $1 Billion
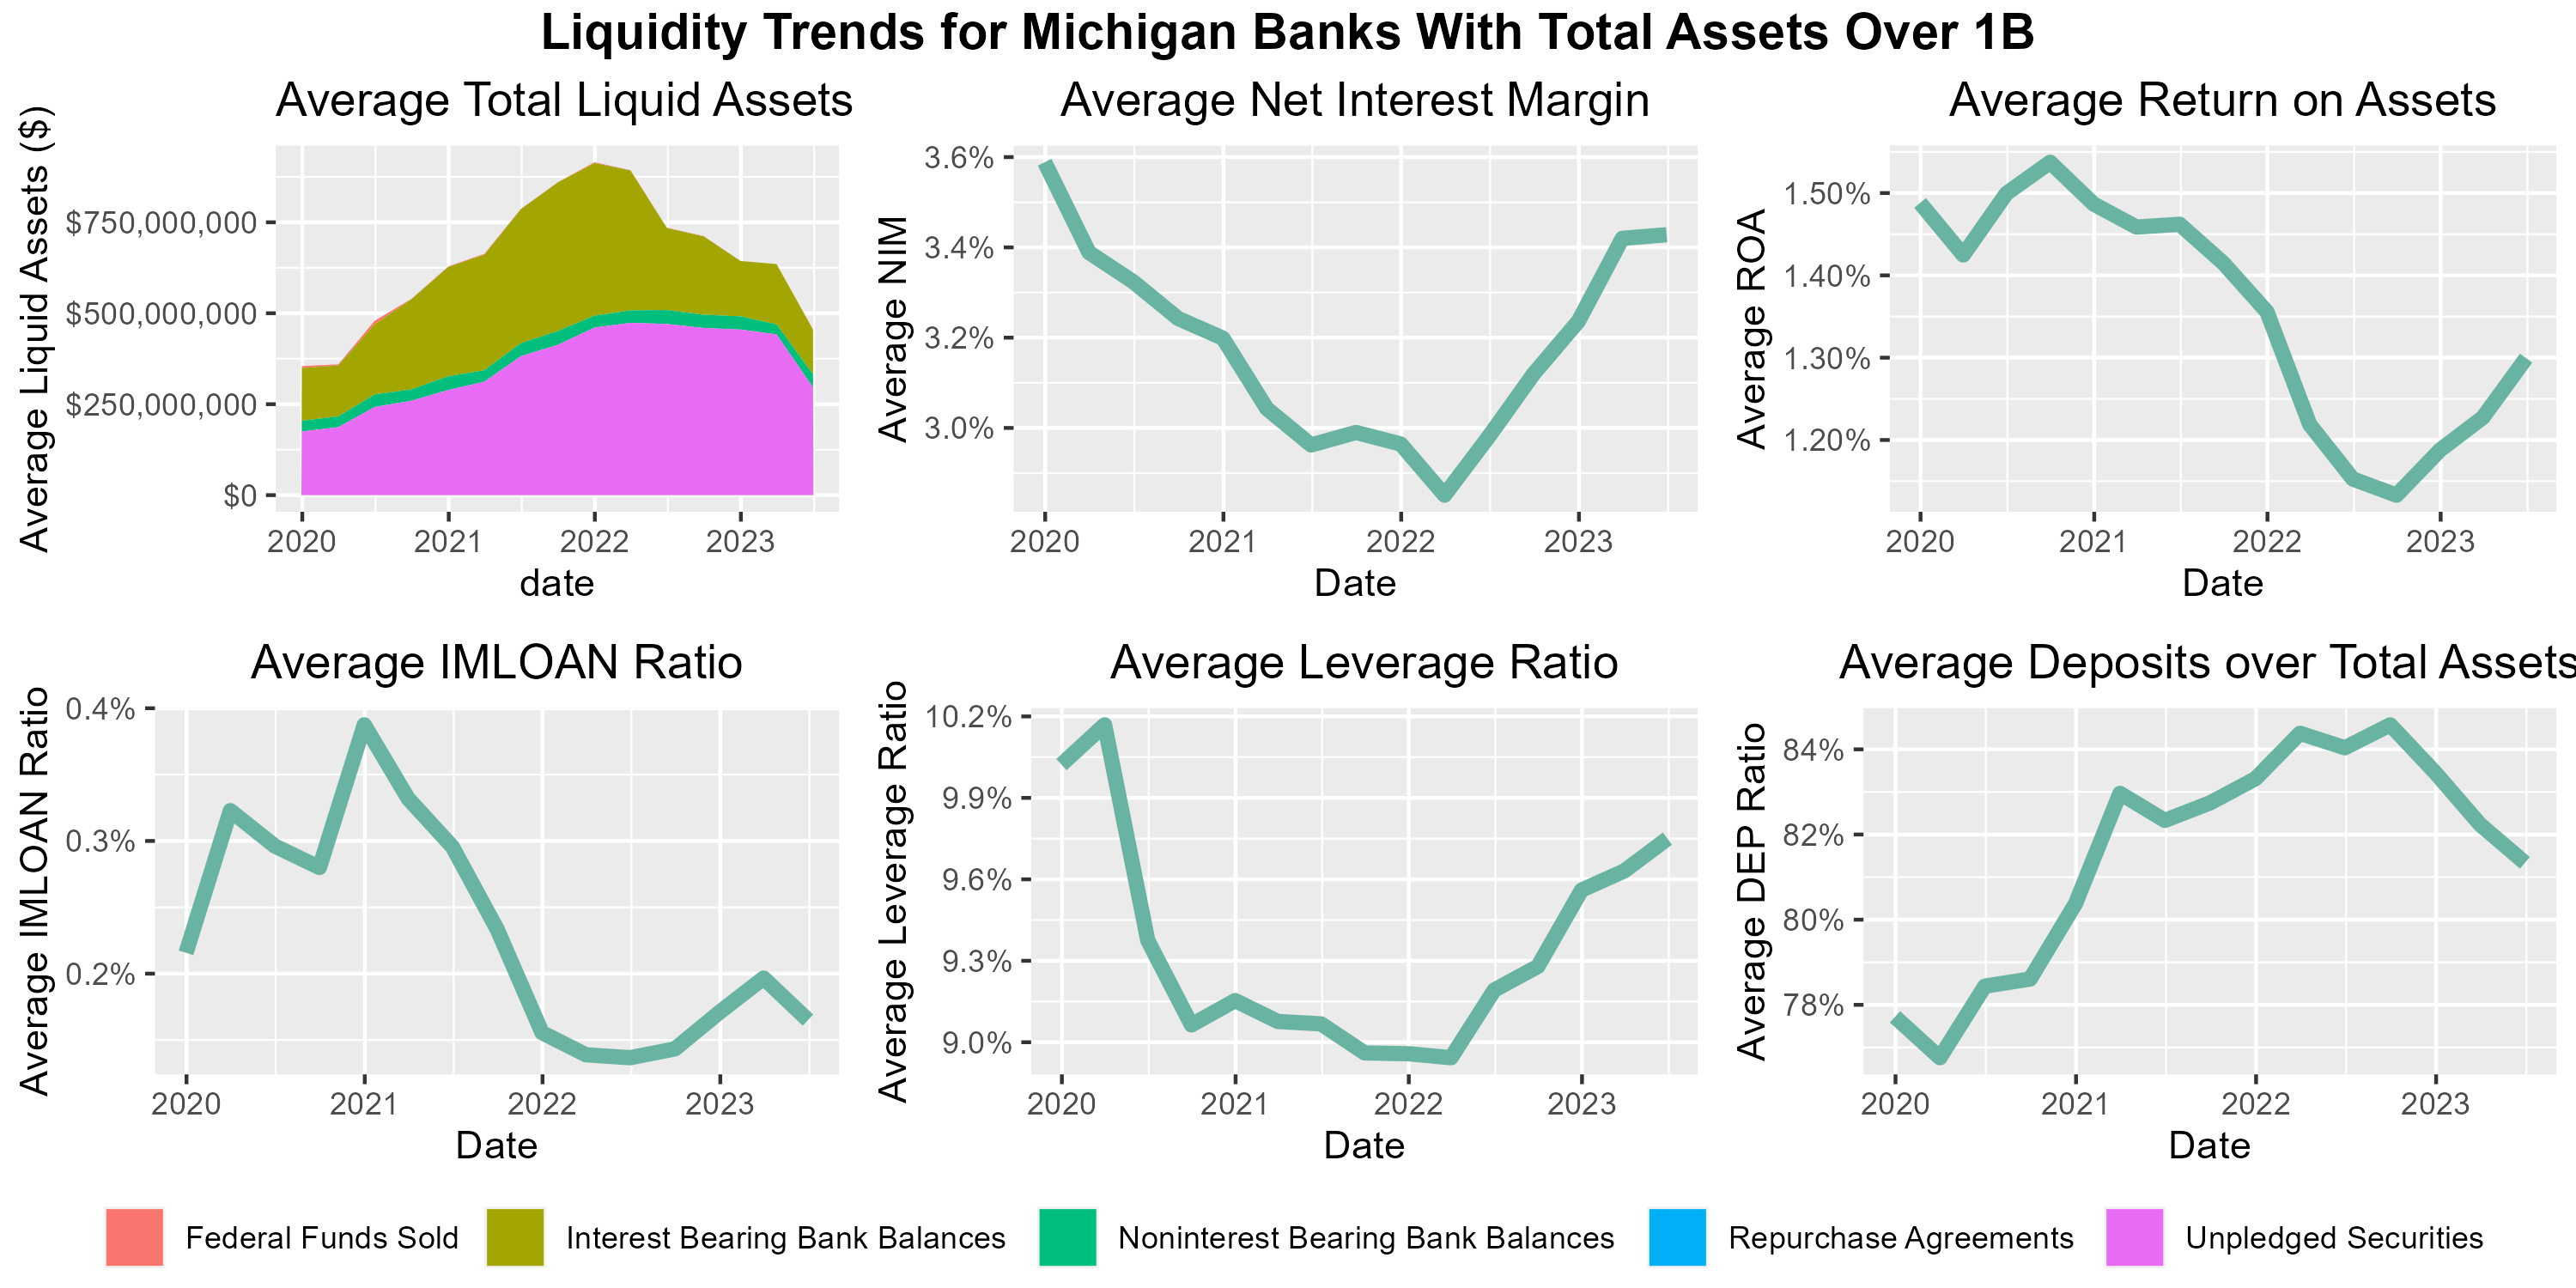
Figure 7. Liquidity Trends for Banks with Total Assets Over $1 Billion
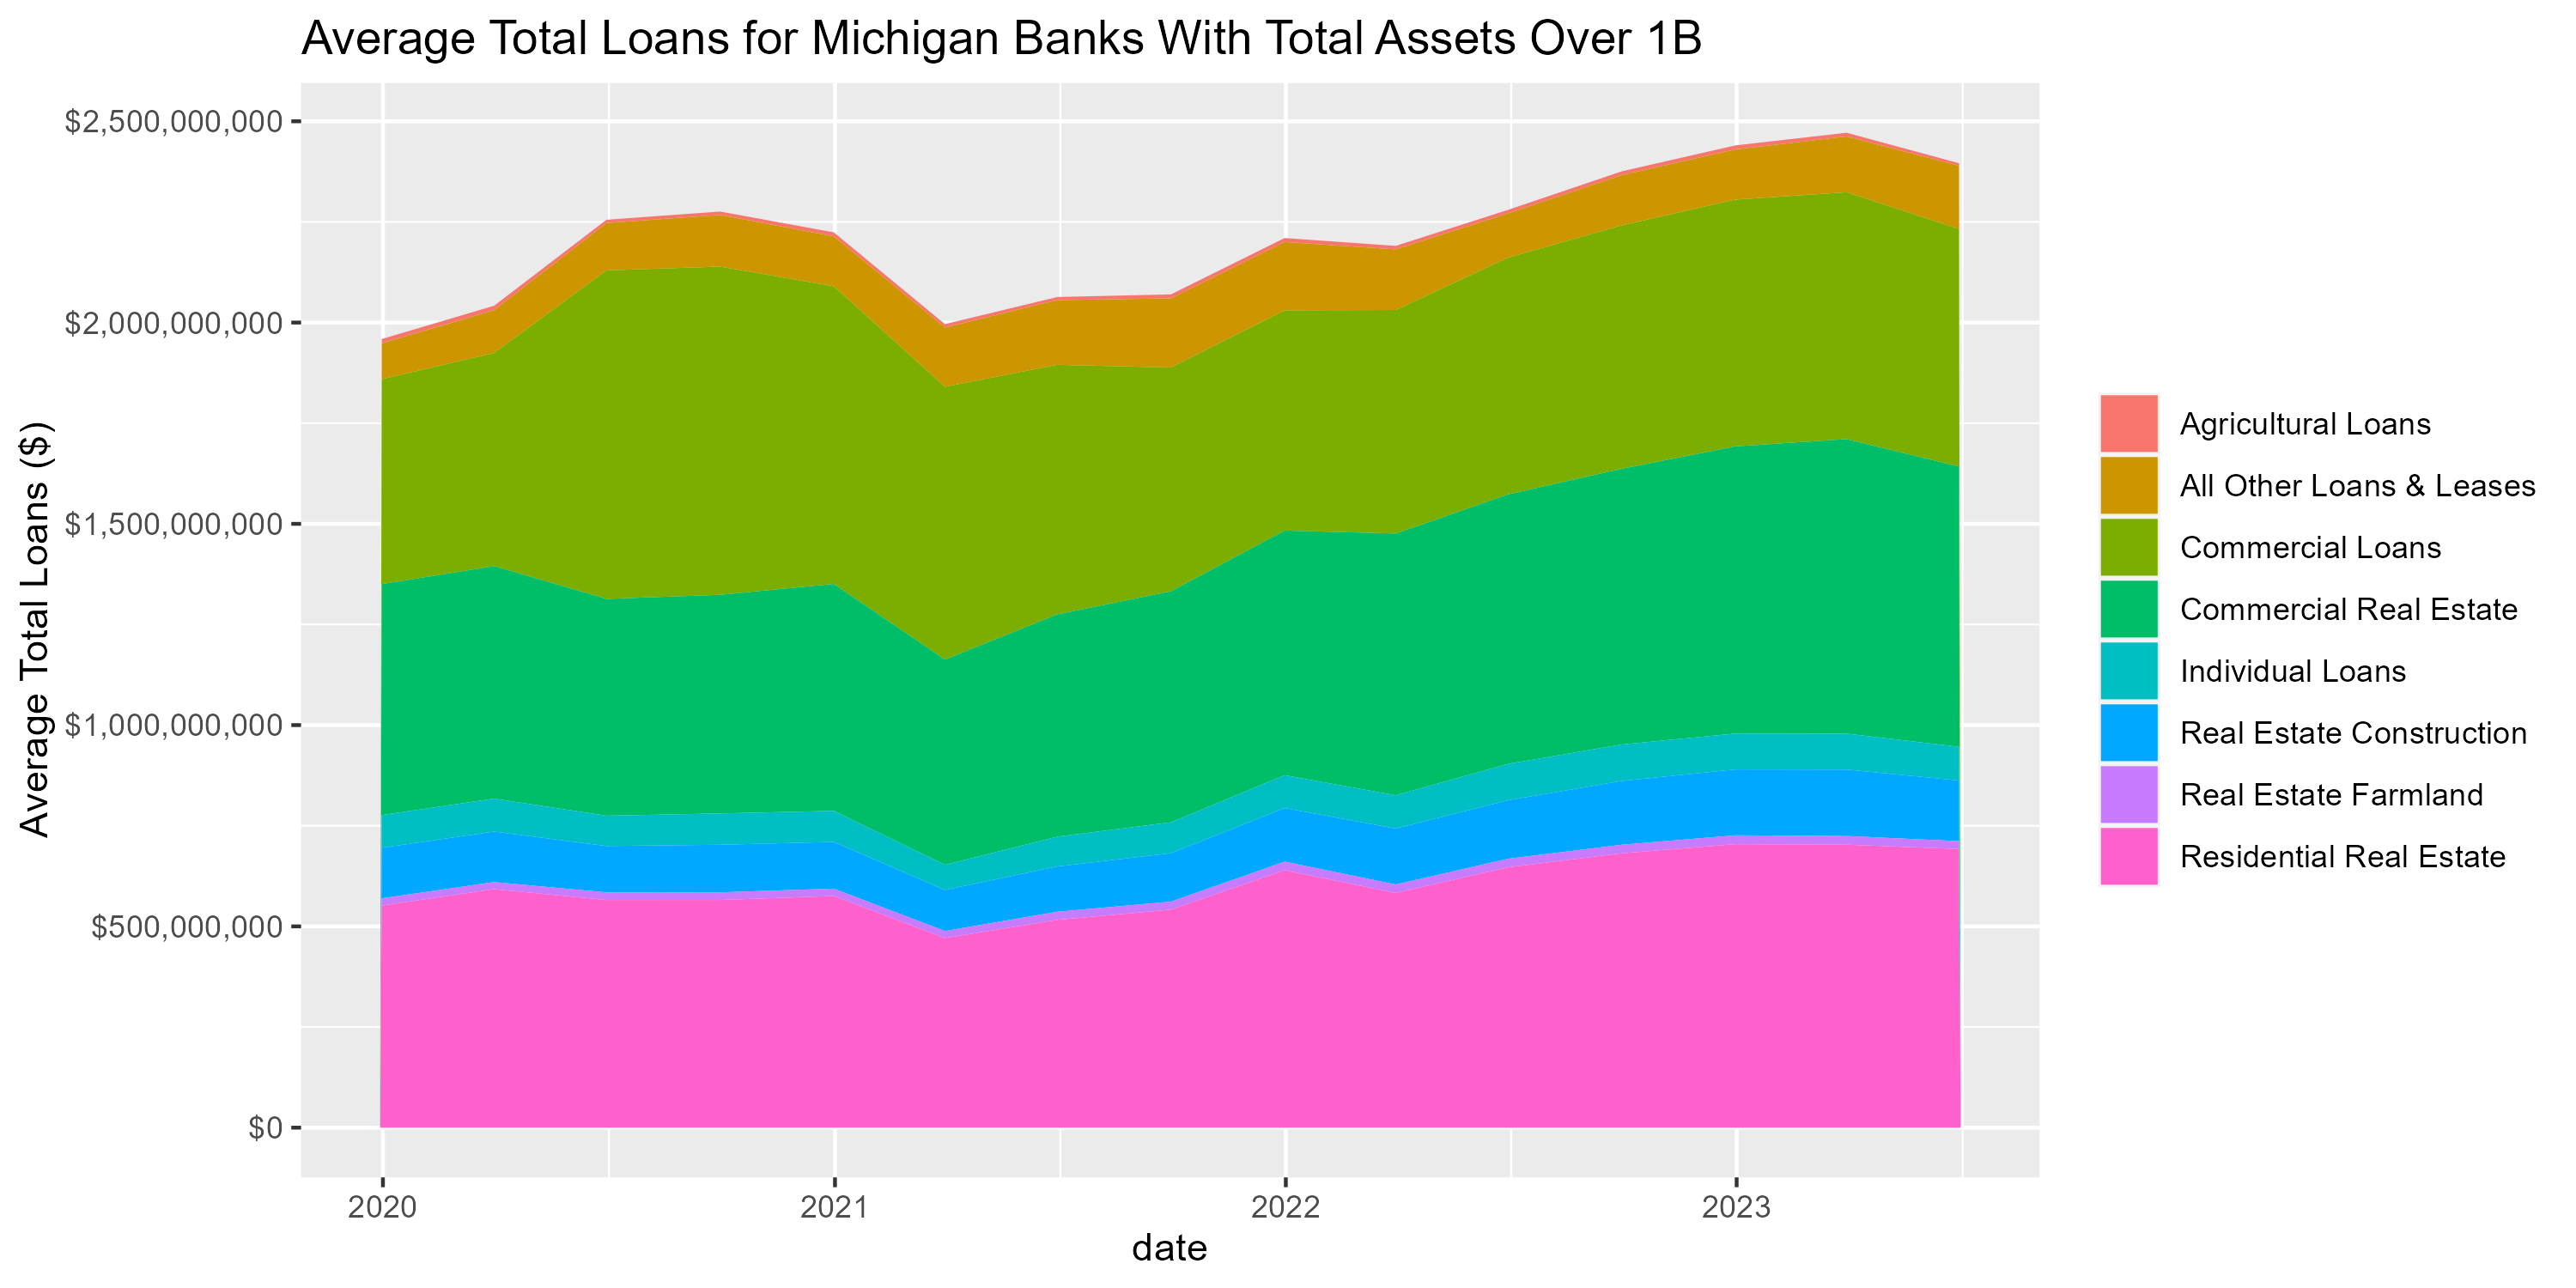
Figure 8. Average Loans for Michigan Banks with Total Assets Over $1 Billion
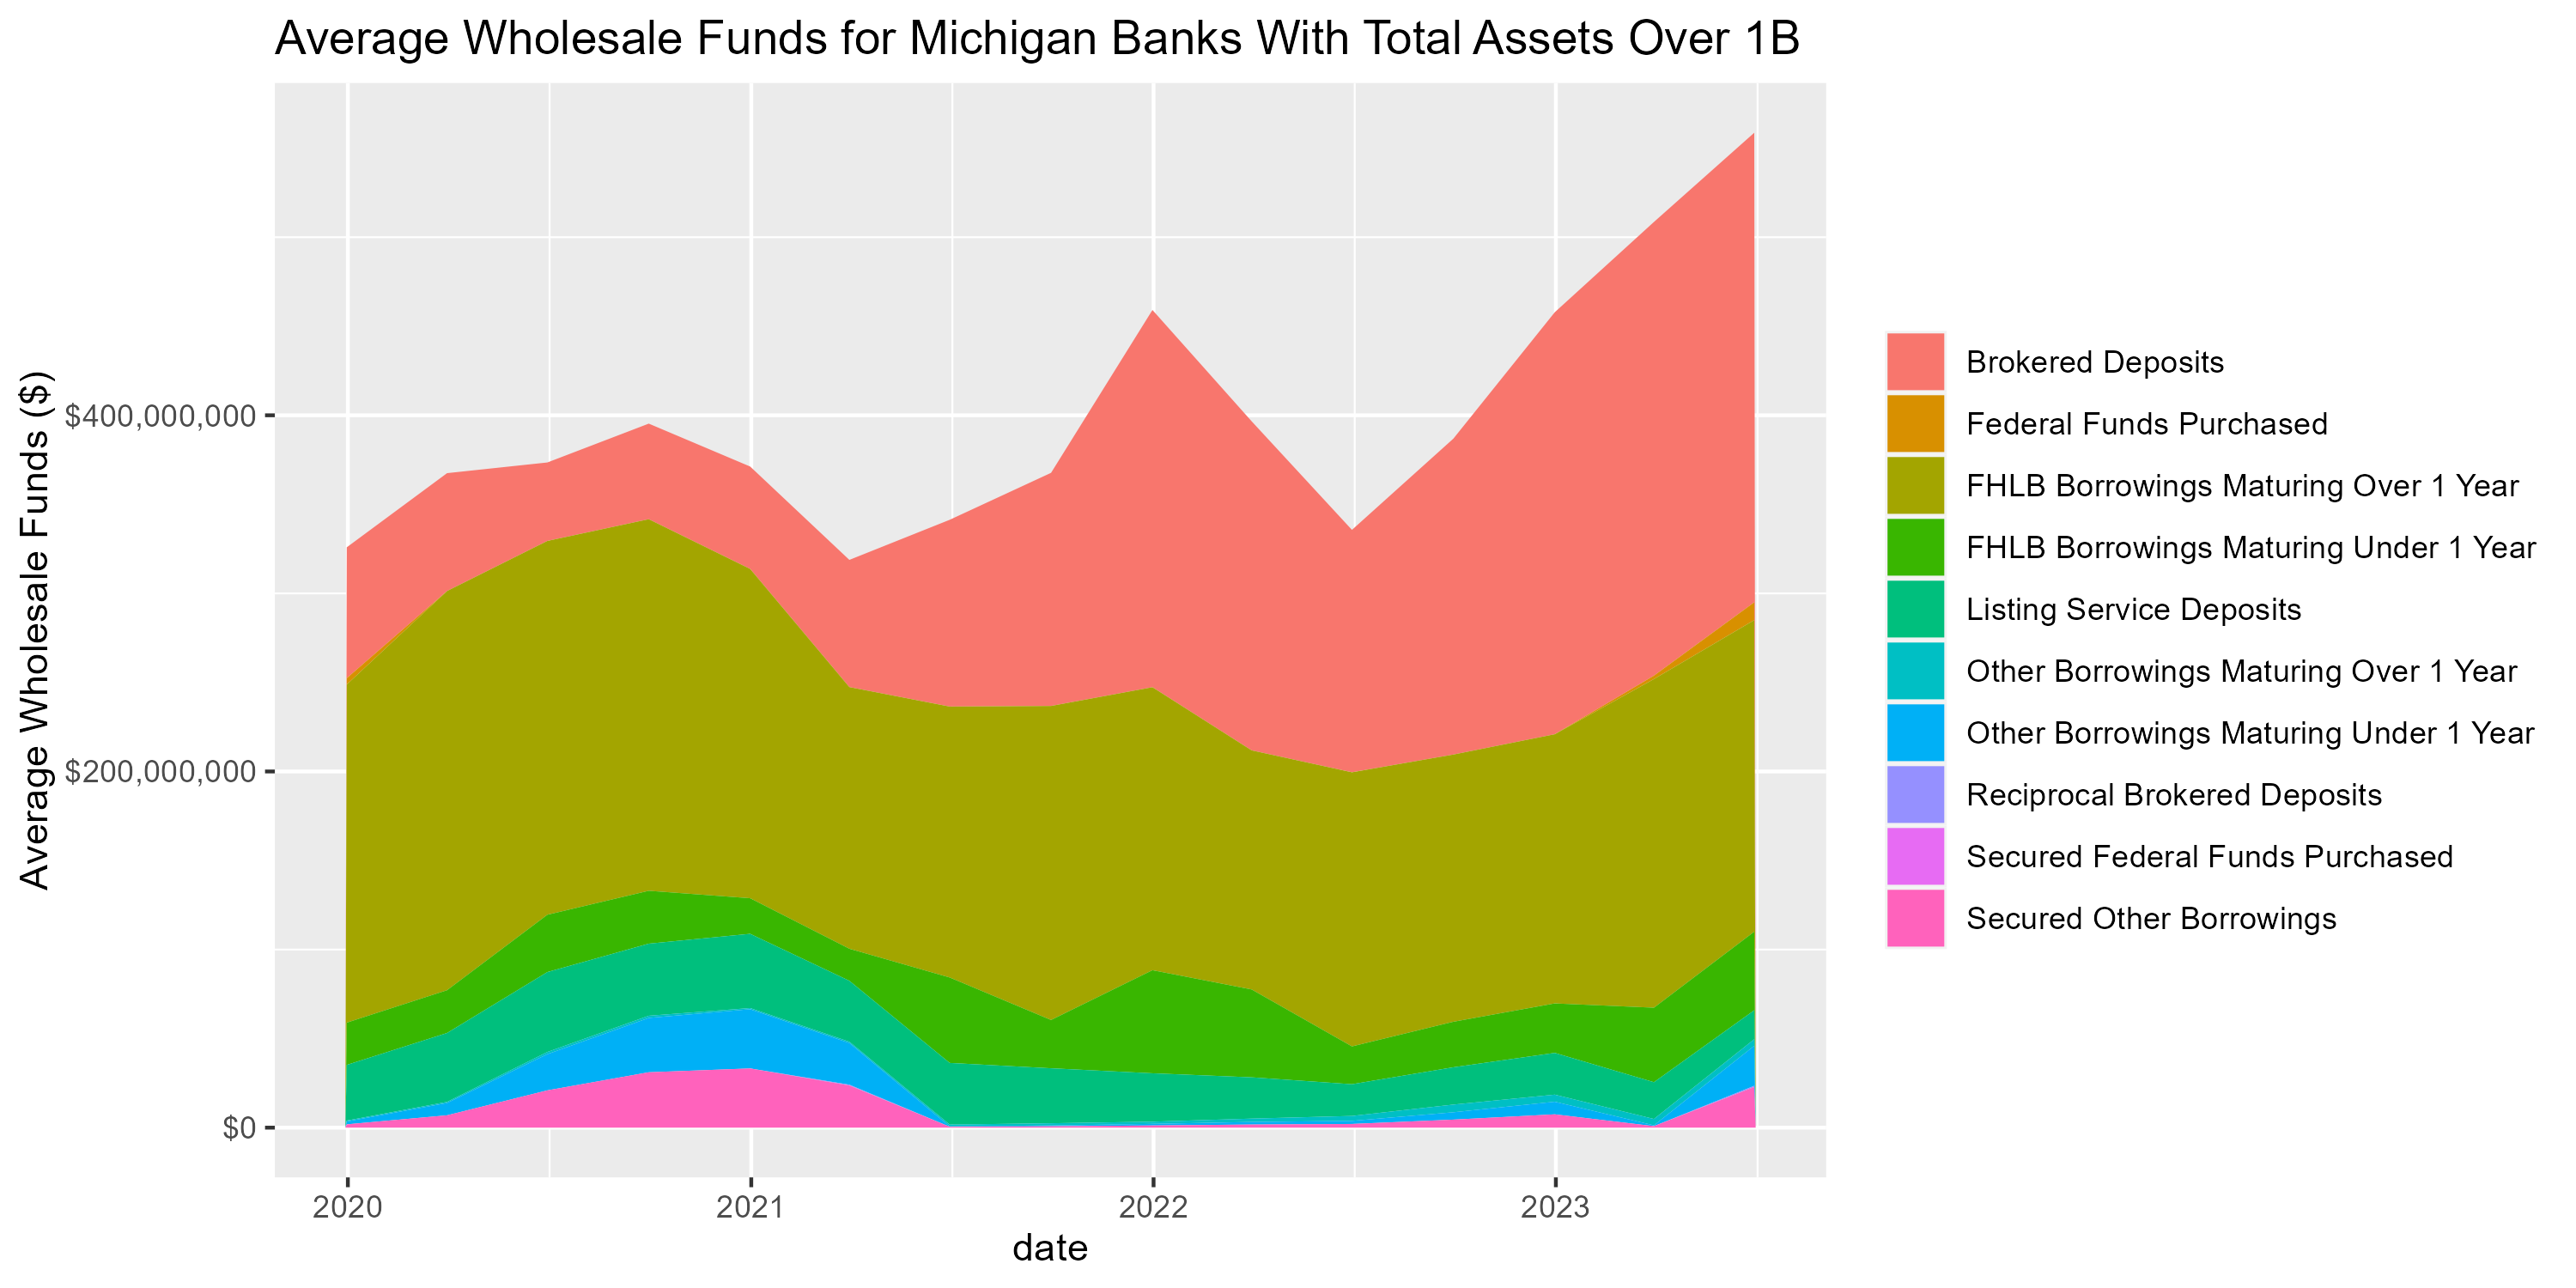
Figure 9. Average Wholesale Funding for Michigan Banks with Total Assets Over $1 Billion
Enjoy Reading This Article?
Here are some more articles you might like to read next: