NEAT Project
Introduction
I began my current research project with a simple question: can I evolve an artificial neural network (ANN) to accurately predict the closing price of a stock?
Artificial Neural Networks
ANNs are inspired by biological brains and are made up of densely interconnected nodes. Instead of neurons and synapses, ANNs utilize artificial neurons (nodes) and connections.
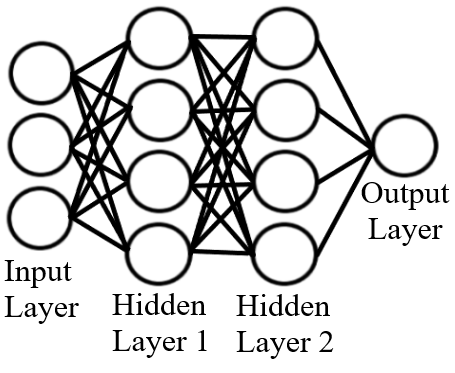
Figure 1 Visual representation of an artificial neural network. The circles represent nodes and the lines connecting the nodes are connections. Nodes change their outputs based on the values received from connections.
Input Layer
All ANNs are made up of 3 types of layers. The first layer is the input layer shown in Figure 1. This is the initial data that is read by the neural networks. For this project, the input layer will consist of historical trading data. To learn about the inputs I am using, scroll down to the Stock Data section.
Connections
Connections transmit signals in the form of real numbers and each connection has its own weight. The purpose of connection weights is to either strengthen or weaken the signal that is being transmitted. ANNs learn by adjusting their connection weights. As ANNs learn, important connections will develop larger weights as weights for unimportant connections become smaller.
Hidden Layers
The hidden layers come after the input layer and is where all the computation is done. The artificial neural network in Figure 1 has two hidden layers made up of four nodes in each layer. The nodes that are in the hidden layers must find the sum of all input signals multiplied by their corresponding weights, add a node bias, and plug the result in an Activation Function.
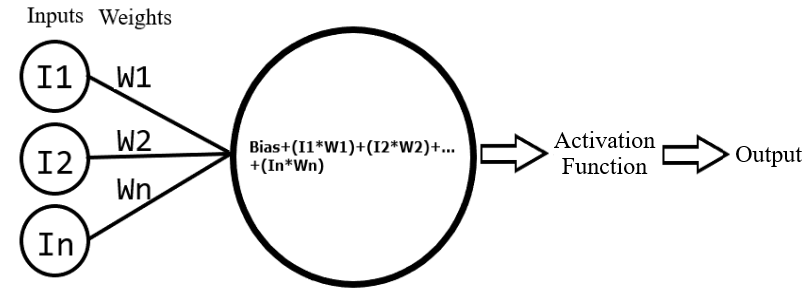
Figure 2 visual representation of a node. The large circle represents the node and shows the addition of the bias to the summation of the inputs multiplied by the connection weights. The value the node calculates is then plugged into a non-linear activation function and the result is the node output.
An Activation Function is a non-linear function used by nodes to produce an output. A common example of an Activation Function would be the sine function. The node bias shown in Figure 2 is a value added to the sum of all input signals multiplied by their weights. The purpose of adding a node bias is to move the Activation Function. The bias acts very similarly to the constant b in the linear function: y=ax+b. When the constant b is changed, the line will move up or down changing the y-axis. Moving an Activation Function greatly impacts the output of a node which may be useful in the learning process.
Output Layer
The last layer for Figure 1 is the output layer. The output layer is that last set of nodes that produce outputs. My ANNs will only have one node in the output layer. This last node will be responsible for outputting the closing price prediction.
NEAT
While researching ANNs, I was introduced to the Neural Evolution of Augmenting Topologies (NEAT). NEAT was developed by Dr. Kenneth O. Stanely and is a method for evolving the structure ANNs. Unlike traditional ANNs that only adjust connection weights, NEAT gives ANNS the ability to change nodes, weights, and connections. The NEAT approach allows ANNS to add or delete connections and nodes. Stock market data is extremely noisy and allowing the structure of my ANNs to change may give them a competitive advantage.
Tesla Stock
For this project, I am using a stock with a highly volatile price. I want to use a stock with a highly volatile price because I believe it will lead to more versatile and complex algorithms. I chose to train on $TSLA because it meets my volatility requirement with a 52-week price range of $211.00 - $1027.48.
Stock Data
The financial data consists of historical trading data and technical indicators. There are 19 variables in my dataset which serve as inputs for my ANNs. The financial data I decided to use for this research project was largely influenced by Improving Stock Closing Price Prediction Using Recurrent Neural Network and Technical Indicators. The historical trading data was downloaded from yahoo finance.
Neat-Python
I used the neat-python implementation of NEAT for this project. Neat-python is a library with tools that maintain individual genomes (artificial neural networks). These genomes are made up of genes that contain important information about the structure of the algorithm.
Methods
Training and Testing Data
The first thing my program does is split my financial dataset into two pieces. The first 70% of the dataset becomes the training data, and the last 30% of the dataset becomes the testing data.
Measuring Performance
The training dataset is first randomly sampled. Then the ANNs produce outputs (closing price predictions) from the sampled data. While the ANNs produce outputs, their error is determined by subtracting their output from the expected output (closing stock price).
Speciation and Reproduction
Once the ANNs have completed the training dataset, they are divided up into species based on genomic distance (this is a measure of how similar genomes are based on their structure i.e. nodes and connections). After all the ANNs have been put in a species, parents are selected to produce offspring through sexual and asexual reproduction. These offspring may be mutated and will be the next generation of ANNs. This cycle of measuring performance, speciation, selection, reproduction, and mutation will continue for N generations.
Testing Data
After N generations, my code checks to see if the best ANN meets my performance threshold.
• If the best performing ANN does not meet this threshold, the ANNs continue to run on the training data for N generations.
• When the best ANN meets this performance threshold, it is run on the entire testing dataset. The outputs (stock price predictions) are recorded, and my code checks to see if the best neural network is good enough to stop running the program.
Exploratory Runs
After I wrote the initial code, I ran several exploratory runs to make sure everything worked properly. These exploratory runs also helped me understand how NEAT behaves in different conditions. Before using financial data, I used numbers from a sine wave as inputs to see if my ANNs could predict the sine wave. The ANNs were successful and I made several adjustments to my code. One of these adjustments was lowering the species compatibility threshold because I noticed that most species collapsed after a few hundred generations.
Current Experiments
My first experiment was to see if my ANNs could predict the closing stock price using normalized data. I graphed the best ANNs testing data predictions for all 50 runs. As a baseline, I chose to use yesterday’s closing price as the current day’s prediction. The baseline will be represented with red dots in Figures 3 through 5.
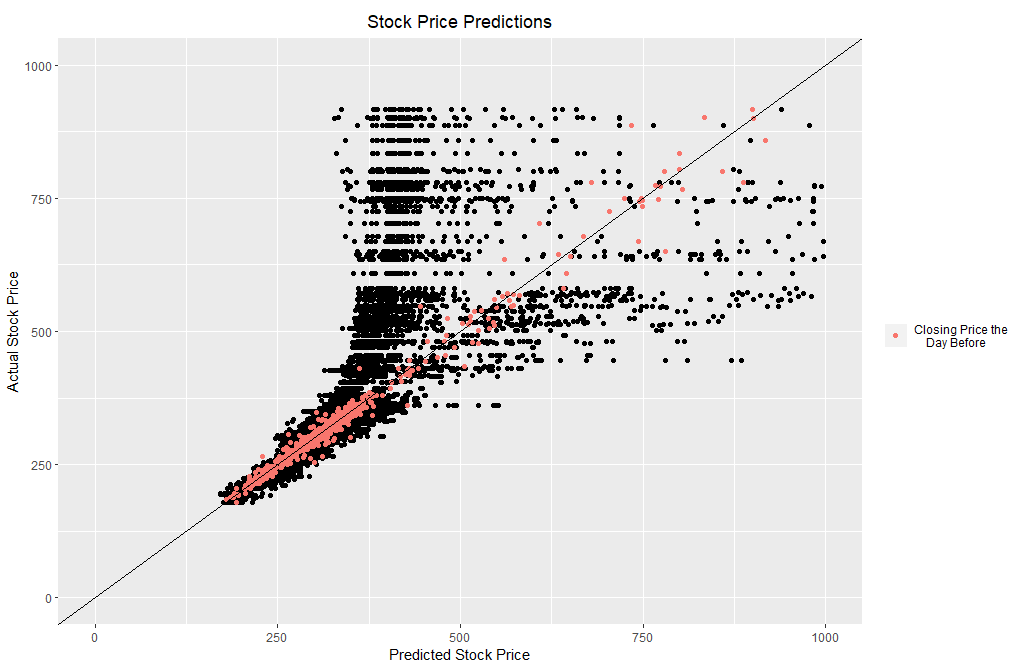
Figure 3 Artificial neural network testing data results after 15,000 generations for all 50 runs.
When looking at Figure 3, it is clear the ANNs could not perform as well as the baseline. I started to investigate what could cause this problem and came up with several hypotheses. My first hypothesis was that only giving the ANNs one Activation Function hindered their ability to predict large numbers. After giving the ANNs access to all Activation Functions in the neat-python library, this was the result:
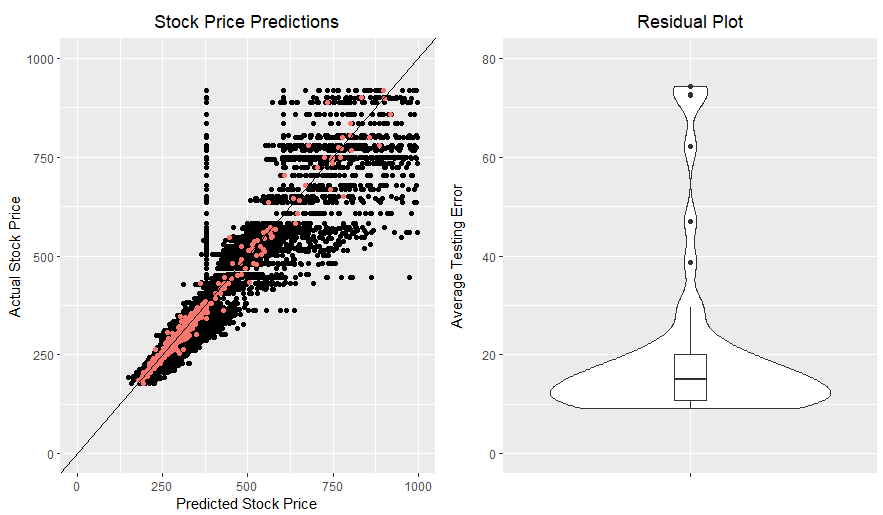
Figure 4 Artificial neural network testing data results after 20,000 generations for all 50 runs.
compared to the previous experiment, the ANNs clearly performed much better with access to all Activation Functions. Despite this improvement, the ANNs still failed to outperform the baseline as shown in Figure 4. My second hypothesis was that normalizing the data made it difficult for the ANNs to identify important inputs. Here is the result of giving the ANNs access to all Activation Functions and running them on un-normalized data:
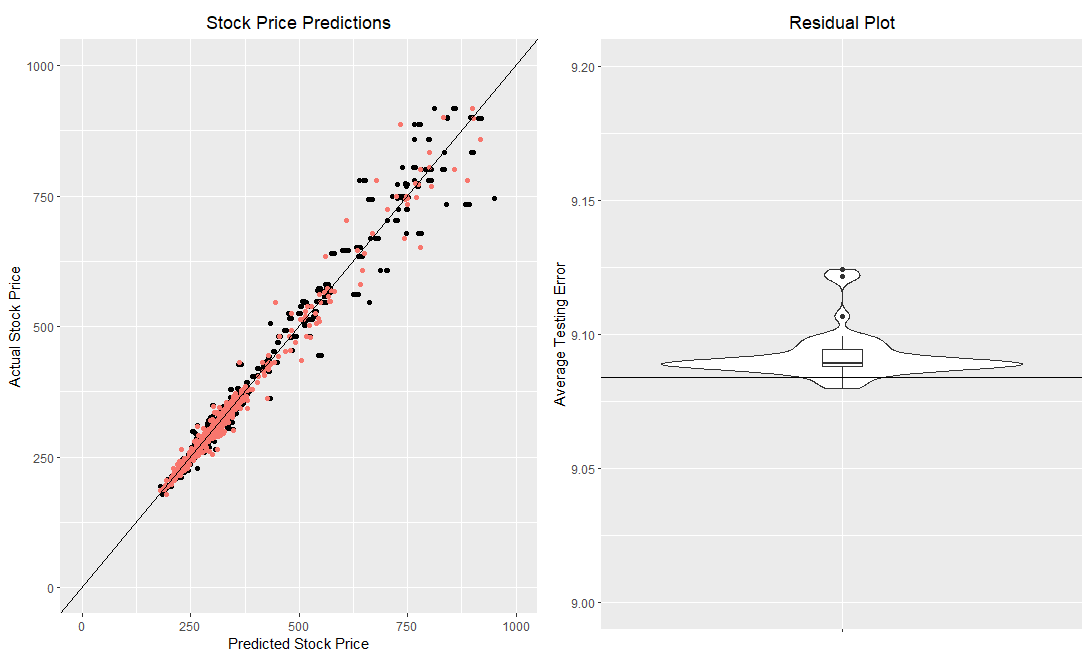
Figure 5 Artificial neural network testing data results after 15000 generations for all 50 runs. The horizontal line added to the residual plot shows the average error for my baseline
When looking at Figure 5, it is now obvious that my ANNs are doing as well as the baseline. Although the baseline is being met, the ANNs are using the baseline strategy and struggling to improve.
Future Work
This project has come quite far, and I have plenty of ideas for the direction of this research project. For future experiments, I plan on experimenting with other selection schemes. I would also like to switch from feed forward to recurrent neural networks.
References
Stanley, K. O., & Miikkulainen, R. (2002, May). Efficient evolution of neural network topologies. In Proceedings of the 2002 Congress on Evolutionary Computation. CEC’02 (Cat. No. 02TH8600) (Vol. 2, pp. 1757-1762). IEEE.
Gao, T., & Chai, Y. (2018). Improving stock closing price prediction using recurrent neural network and technical indicators. Neural computation, 30(10), 2833-2854.
Enjoy Reading This Article?
Here are some more articles you might like to read next: