Liquidity Determinants of Michigan Banks
DISCLAIMER: This is a personal blog. Any views or opinions expressed in this blog do not represent the official policy or position of the Michigan Department of Insurance and Financial Services.
Introduction
This article investigates bank-specific factors that determine the level of liquid assets held by state chartered commercial banks in Michigan. Bank-specific factors include bank size, profitability, capital adequacy, deposits, and asset quality. This study consists of balanced panel data of 59 state chartered commercial banks from December 31st, 2019, until June 30th, 2023.
Under the fractional reserve banking system, banks only hold a fraction of their deposit liabilities in liquid assets to meet anticipated liquidity needs. Bank management is responsible for determining the appropriate level of liquid assets required to meet the demands of depositors and creditors while allowing for the greatest profitability. Developing a better understanding of the determinants of liquid assets will give key insights into ongoing liquidity trends.
Literature Review
In 1999, an analysis of the Mexican banking system found that capital had a significant positive effect on liquid assets while total asset size (in relation to the total assets of the banking system) had no statistically significant effect on any measure of liquid assets. Additionally, this study theorized that banks with relatively more demand deposits possess more liquid assets but found that the level of demand deposits relative to total assets had a significant negative effect on securities and liquid assets but not the level of cash. This finding could suggest that banks consider demand deposits to be a very stable liability, or the variance of deposit withdraws declines as deposits increase and the deposit population becomes more diverse (Alger & Alger, 1999).
The relationship between liquid assets and bank size was further examined in a 2015 study of 18 Tunisian banks. This study used the natural logarithm of total assets as a measure of bank size and also found that bank size did not have a significant impact on bank liquidity. Additional variables in this study included return on assets (ROA), return on equity (ROE), net interest margin (NIM), total loans, operating expenses, total deposits, financial expenses, equity, inflation rate, and growth rate of GDP. ROA, ROE, capital, operating expenses, growth rate of GDP, and inflation rate were found to have had a significant impact on bank liquidity. Total loans, financial costs, and total deposits did not have a significant impact on bank liquidity (Moussa, 2015).
Macroeconomic as well as bank-specific determinants of liquidity of Indian banks were studied by Singh and Sharma (2016). Bank-specific determinants studied in this paper include bank size, profitability, cost of funding, capital adequacy, and deposits. Macroeconomic determinants of liquidity included GDP, inflation, and unemployment. This study found that bank size and GDP had a negative relationship with liquidity at a 5 percent confidence interval while profitability, deposits, inflation, and capital adequacy had a positive impact.
Specification of Variables
The dependent variable in this article is liquidity which was measured through two liquidity ratios provided by Vodová (2011). Fixed and random effect regression was performed for both measures of liquidity. The first measure of liquidity is net loans as a fraction of total assets (Liq1). The ratio Liq1 indicates the percentage of bank assets which are invested in illiquid loans. The higher this ratio is, the fewer liquid assets a bank possesses. The second measure of liquidity is liquid assets as a fraction of total assets (Liq2). The ratio Liq2 indicates the percentage of bank assets which are liquid. A high ratio may indicate an inefficiency since liquid assets yield less income than illiquid assets. Liquid assets consist of interest as well as non-interest bearing bank balances, securities sold under agreement to repurchase, federal funds sold, and total securities less pledged securities.
Table 1
Summary of variables and expected relationships with the dependent variables.
| Independent Variable | Proxy/Measurement | Notation | Expected Effect |
|---|---|---|---|
| Bank Size | Natural log of total assets | SIZE | Negative |
| Profitability | Return on assets | ROA | Negative |
| Deposits | Deposits over total assets | DEP | Positive |
| Capital Adequacy | Tier 1 leverage ratio | CAP | Positive |
| Interest Margin | Net interest margin | NIM | Negative |
| Asset Quality | Nonaccrual loans over total loans | IMLOAN | Negative |
Bank Size (SIZE). The size of banks (SIZE) has been measured using the natural logarithm of total assets. Sing et al. (2016) and El-Chaarani (2019) stated that bank size has a significant negative effect on liquidity. Smaller banks rely on a buffer of liquid assets while larger banks rely on credit instruments and the inter-bank market which is in accordance with the “too big to fail” hypothesis.
Profitability (ROA). Return on assets is the proxy of profitability in this article. Return on Assets (TTM) measures the net income over the prior four quarters over average total assets. Moussa (2015) found that banks with higher return on assets had lower levels of liquidity. Banks with less liquid assets have a higher return on assets due to liquid assets generally yielding less income than illiquid assets.
Deposits (DEP). Deposits (DEP) have been calculated as total deposits over total assets. Sing et al. (2016) stated that the level of deposits has a positive effect on liquidity. Deposits are the major source of funds for banks and these institutions must maintain adequate levels of liquidity to meet customer demand.
Capital Adequacy (CAP). The tier 1 leverage ratio is the proxy of capital adequacy in this article. Sing et al. (2016) and Alger et al. (1999) found that capital adequacy had a positive influence on liquidity as a whole. Alger et al. (1999) suggests that banks invest more in liquid assets as a precaution when more capital is at stake.
Interest Margin (NIM). Net interest margin is the measure of interest income less interest expenses over average earning assets. According to finance theory, interest margin should be negatively correlated with liquidity. Vodová (2013) found that liquidity is negatively affected by interest margin.
Asset Quality (IMLOAN). Total nonaccrual loans over total loans is the proxy of asset quality in this article. Munteanu (2012) stated that the level of impaired loans has a significant negative effect on liquidity. A higher level of nonaccrual loans may lead to increased lending activity to make up for losses thus decreasing the level of liquid assets.
Model Specification
Two models will be estimated:
\[Liq1_{it} = \alpha_{it}+β_{1}SIZE_{it}+β_{2}ROA_{it}+β_{3}DEP_{it}+β_{4}CAP_{it}+β_{5}IMLOAN_{it}+ ε_{it}\] \[Liq2_{it} = \alpha_{it}+β_{1}SIZE_{it}+β_{2}ROA_{it}+β_{3}DEP_{it}+β_{4}CAP_{it}+β_{5}IMLOAN_{it}+ ε_{it}\]β1, β2 , β3, β4, and β5 are the coefficients of the determinant variables and ε is the error term. The panel data was constructed with indices “i” and “t” representing individual banks and time, respectively. The data is comprised of 59 banks from December 31st, 2019, until June 30th, 2023. The total number of observations is 885.
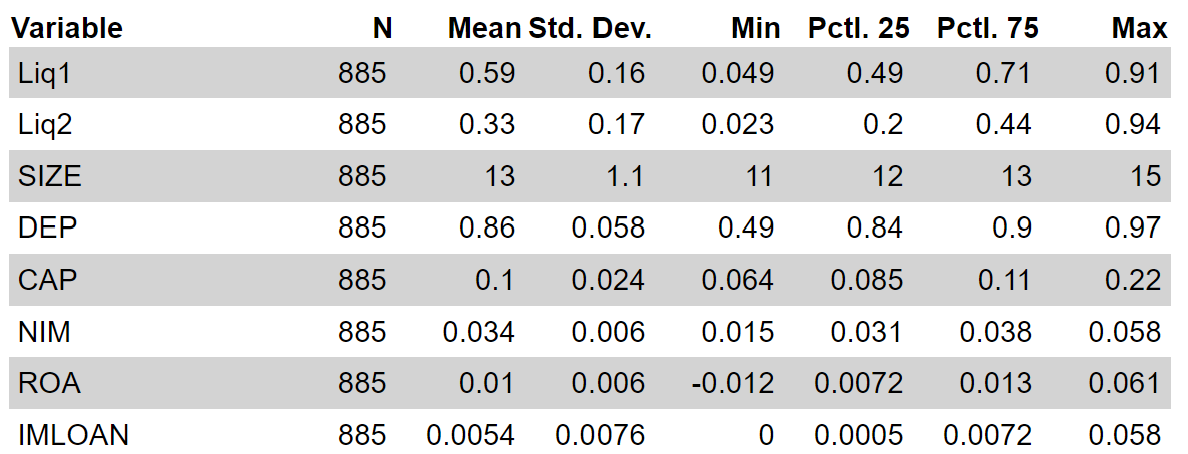
Descriptive Statistics
Table 2 highlights the descriptive statistics for state chartered Michigan banks. Based on the findings below, net loans on average represented 59 percent of total assets (Liq1) for Michigan banks. Additionally, liquid assets constituted 33 percent of total assets (Liq2) on average.
Table 2
Descriptive Statistics (Sample 12/31/2019 - 06/30/2023)
Fixed Effect and Random Effect Regression
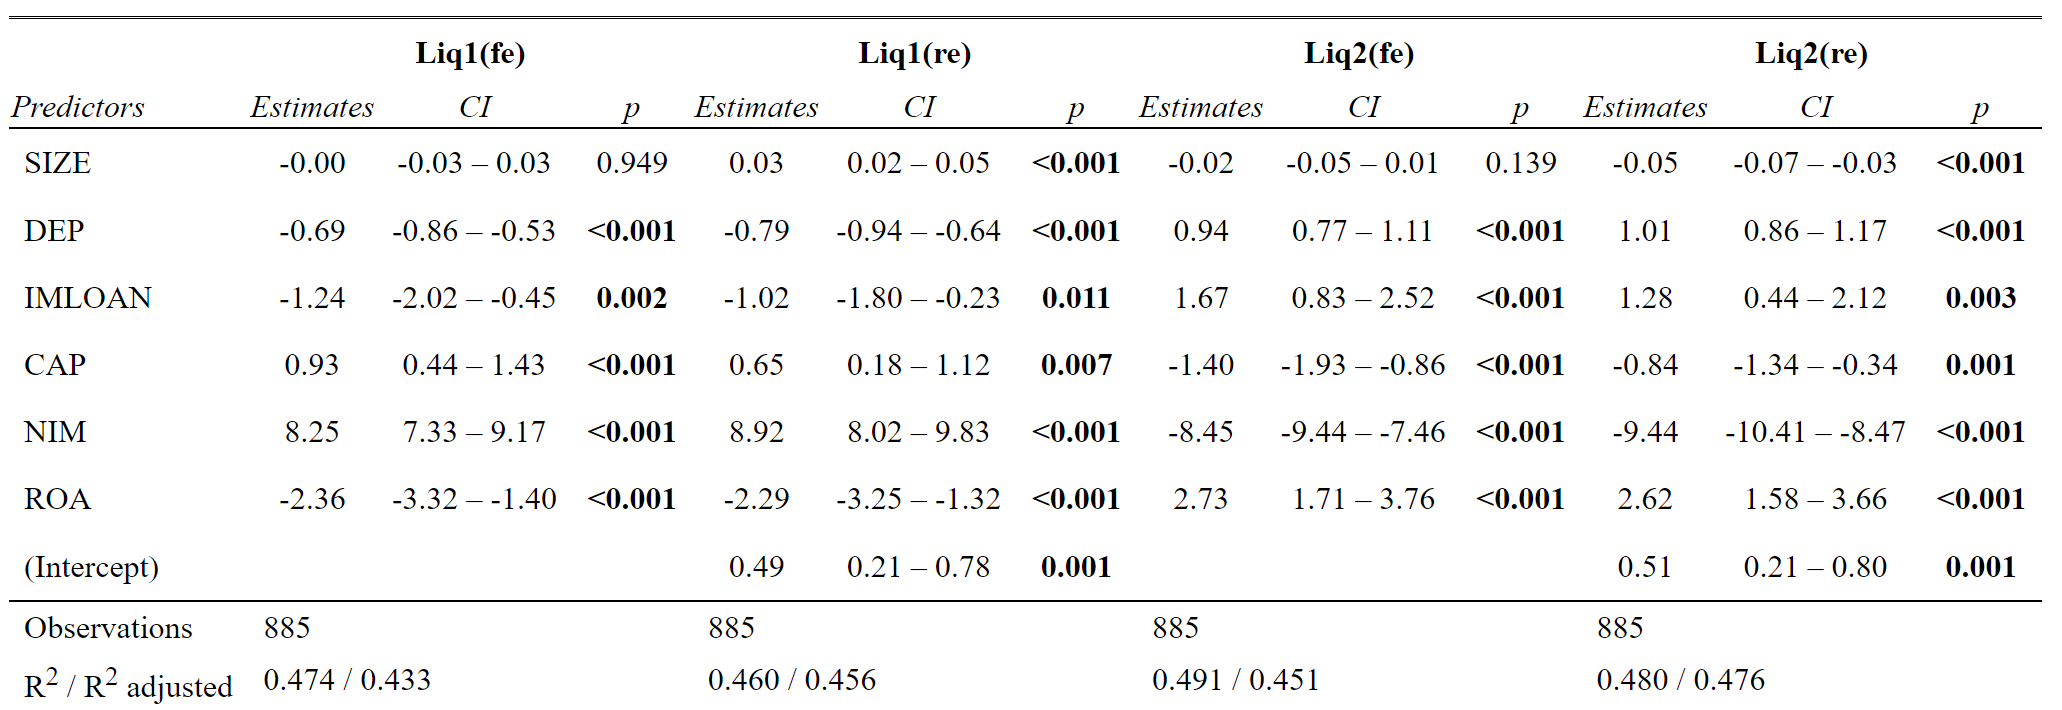
Fixed effect and random effect regressions were run and a Hausman test was carried out to choose the appropriate model. The Hausman Test for both measures of liquidity resulted in a p-value less than 0.05, confirming that the fixed effect regression was the preferred model for Liq1 and Liq2. Results are shown in Table 3.
The fixed effect models concluded that DEP, IMLOAN, CAP, NIM, and ROA significantly impacted the first measure of liquidity (Liq1) as well as the second measure (Liq2). The impact of DEP, IMLOAN, and ROA on Liq1 (net loans / total assets) was negative whereas the impact of CAP and NIM was positive. However, the impact of DEP, IMLOAN, and ROA on Liq2 (liquid assets / total assets) was positive while the impact of CAP and NIM was negative. SIZE was found to have an insignificant effect on either liquidity measure (Table 4).
Table 3
Hausman Test
| Model | Chi-Sq. Statistic | Prob. |
|---|---|---|
| Liq1 Model | 33.965 | 6.833e-06 |
| Liq2 Model | 56.274 | 2.562e-10 |
Table 4
Regression Analysis
Conclusion
The aim of this article was to identify bank-specific determinants of liquidity for state chartered Michigan Banks. Panel data regression analysis has been used for two measures of liquidity. Bank-specific determinants analyzed include bank size, total deposits, asset quality, capital adequacy, interest margin, and profitability. The findings of this study afford key insights into ongoing liquidity trends and risk.
Liquidity is positively affected by the level of total deposits. In other words, the greater the level of total deposits, the higher the level of liquidity banks hold. Similar results were found in a study by Sing et al. (2016). However, a study by Alger et al. (1999) found a negative relationship between deposits and bank liquidity.
Another major finding of this study is that the level of nonaccrual loans has a positive effect on liquidity. Thus, Michigan banks hold more liquid assets the higher the level of nonaccrual loans. This finding contradicts studies by Munteanu (2012) and El-Chaarani (2019) that have found that nonperforming loans have a negative impact on bank liquidity.
Capital adequacy has a significant negative effect on liquidity. This study contradicts the findings of Sing et al. (2016) and Alger et al. (1999) but is in line with a study conducted by Moussa (2015). The reasons behind this discrepancy is a subject for future study.
In line with the findings of Vodová (2013), net interest margin has a negative effect on bank liquidity. If net interest margin increases by 1 percent, liquidity declines by 8.25 percent and 8.45 percent in the Liq1 and Liq2 models, respectively. Vodová (2013) concluded that higher interest margin leads to increased lending activity thus reducing bank liquidity.
The level of liquid assets held by Michigan banks is positively affected by bank profitability. Similar results were reported by Vodová (2013) and Sing et al. (2016). Higher profitability could indicate that more risk is present on the balance sheet which could require a higher liquidity buffer to mitigate risk.
Bank size has no statistically significant relationship with the liquidity of Michigan state chartered banks. This may be due to the size of the financial institutions included in this article. Studies by Sing et al. (2016) and El-Chaarani (2019) found that smaller banks held a buffer of liquid assets while larger banks held less liquid assets and relied on credit instruments and the inter-bank market. The banks included in this study may be too small to rely on credit instruments and the inter-bank market to meet liquidity needs.
References
Alger, G., & Alger, I. (1999). Liquid assets in banks: Theory and practice. GREMAQ, Universite des Sciences Sociales.
El-Chaarani, H. (2019). Determinants of bank liquidity in the Middle East region. El-CHAARANI H.,(2019), Determinants of Bank Liquidity in the Middle East Region, International Review of Management and Marketing, 9(2).
Moussa, M. A. B. (2015). The determinants of bank liquidity: Case of Tunisia. International journal of economics and financial issues, 5(1), 249-259.
Munteanu, I. (2012). Bank liquidity and its determinants in Romania. Procedia Economics and Finance, 3, 993-998.
Singh, A., & Sharma, A. K. (2016). An empirical analysis of macroeconomic and bank-specific factors affecting liquidity of Indian banks. Future Business Journal, 2(1), 40-53.
Vodová, P. (2011). Liquidity of Czech commercial banks and its determinants. International Journal of mathematical models and methods in applied sciences, 5(6), 1060-1067.
Vodová, P. (2013). Determinants of commercial bank liquidity in Hungary. Finansowy Kwartalnik Internetowy e-Finanse, 9(3), 64-71.
Enjoy Reading This Article?
Here are some more articles you might like to read next: