Neat Project
Predicting Stock Closing Prices with NEAT
Introduction
I began this research project with a simple question: can I evolve an artificial neural network (ANN) to accurately predict the closing price of a stock? For this project, I am using the Neuro Evolution of Augmenting Topologies (NEAT) algorithm to evolve my ANNs. The inputs for my ANNs consist of historical trading data for Tesla and 19 technical indicators. To learn more about artificial neural networks, NEAT, or the financial data I’m using, check out my blog post here.
Methods
Training and Testing Data
The first thing my program does is split my financial dataset into two pieces. The first 70% of the dataset becomes the training data, and the last 30% of the dataset becomes the testing data.
Measuring Performance
The training dataset is first randomly sampled. Then the ANNs produce outputs (closing price predictions) from the sampled data. While the ANNs produce outputs, their error is determined by subtracting their output from the expected output (closing stock price).
Speciation and Reproduction
Once the ANNs have completed the training dataset, they are divided up into species based on genomic distance (this is a measure of how similar genomes are based on their structure i.e. nodes and connections). After all the ANNs have been put in a species, parents are selected to produce offspring through sexual and asexual reproduction. These offspring may be mutated and will be the next generation of ANNs. This cycle of measuring performance, speciation, selection, reproduction, and mutation will continue for N generations.
Testing Data
After N generations, my code checks to see if the best ANN meets my performance threshold.
• If the best performing ANN does not meet this threshold, the ANNs continue to run on the training data for N generations.
• When the best ANN meets this performance threshold, it is run on the entire testing dataset. The outputs (stock price predictions) are recorded, and my code checks to see if the best neural network is good enough to stop running the program.
Results
My first experiment was to see if my ANNs could predict the closing stock price only using one activation function and normalized data. I graphed the best ANNs testing data predictions for all 50 runs. As a baseline, I chose to use yesterday’s closing price as the current day’s prediction. The baseline will be represented with red dots in the following figures.
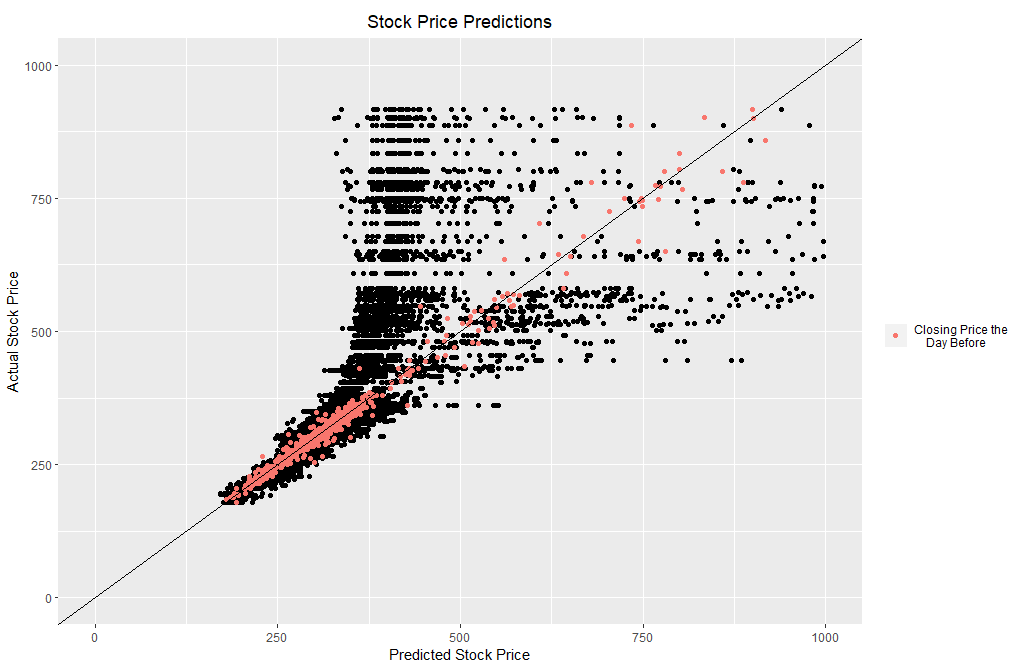
The neural networks could not perform as well as the baseline. For my next experiment, I gave my ANNs access to every activation function in the neat-python library. Here are the results for all 50 runs after 20,000 generations:
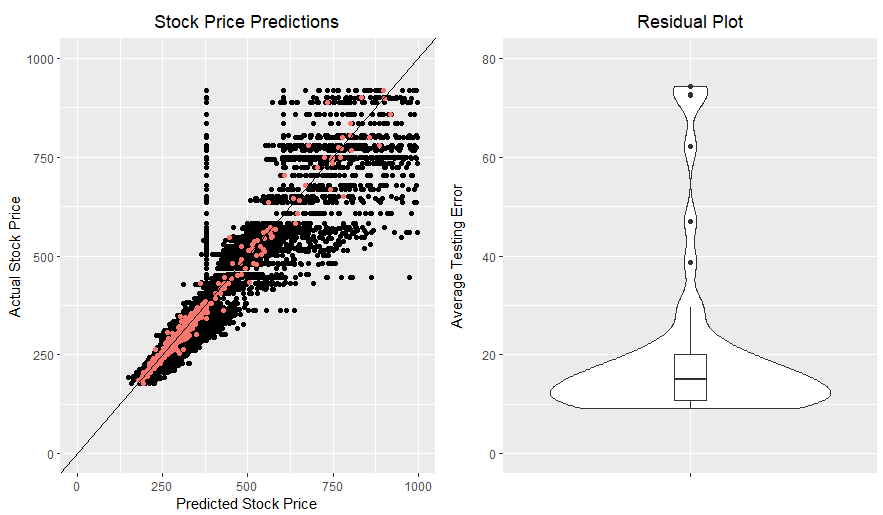
The neural networks improved, but they still failed to surpass the baseline. My next experiment was to run all the ANNs on a un-normalized dataset. This was the result for all 50 runs after 15,000 generations:
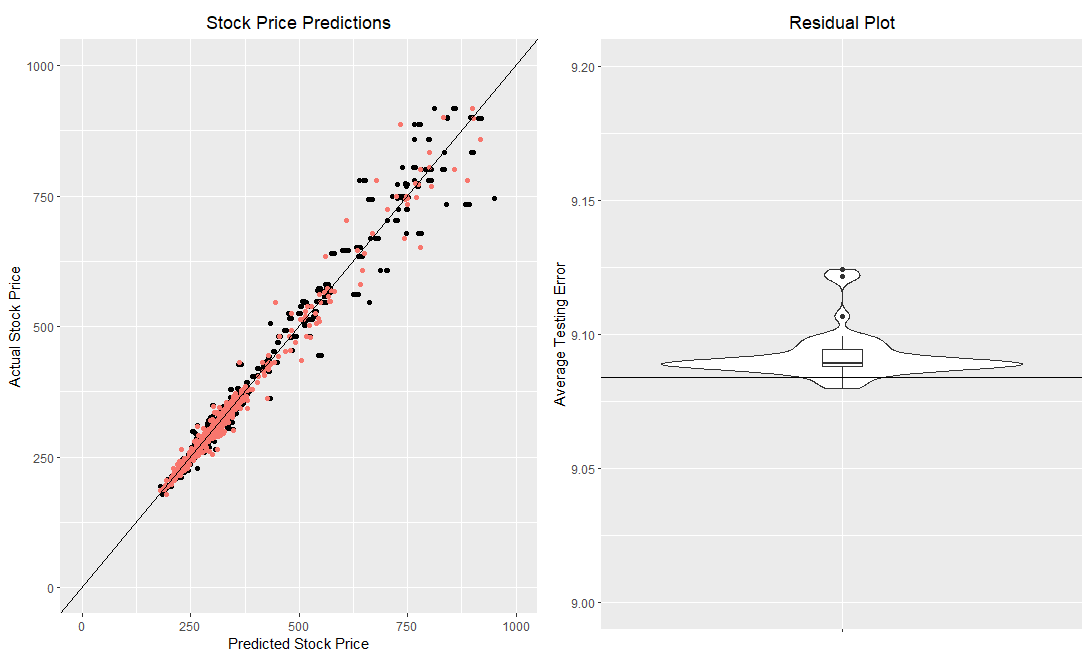
for this figure, I added a horizontal line to the residual plot to show the average error for my baseline. After this experiment, I noticed that all my ANNs were performing about as well as the baseline. This told me that my ANNs were not very complex and were using the baseline strategy. At this point in the project, I switched from using feed forward neural networks to recurrent neural networks. I did this because I believed using recurrent neural networks would lead to more complex algorithms. Here are the results for all 50 recurrent neural network runs after 15,000 generations:

There was more variation in the results of this experiment, but the best genome out of all 50 runs continued to use the baseline strategy. For this experiment, I also kept track of the number of unique populations at the end of each run.
Future Work
For my future work, I plan on doing several experiments adjusting the node bias range. I believe that changing the node bias range could assist certain activation functions in the learning process. I also want to explore different datasets. The dataset I am using now relies heavily on historical analysis. Instead of relying on historical analysis, I may want to use historical trading data of a stock and market returns. To do this, I believe that a stock with a beta close to 1 or -1 would be required.